Curated OER
Linear and Exponential Models
High schoolers investigate the differences between linear and exponential models. In this linear and exponential models activity, students make a table of given data. High schoolers determine if the data is linear or...
Curated OER
Quadratic Equation Calculator
In this Algebra II worksheet, 11th graders use an online quadratic equation solver to find the zeros of a quadratic. The one page interactive worksheet provides one worked example and the equation solver.
Curated OER
Generating Points and Graphing
Students create a table of values to help them plot. In this algebra instructional activity, students plot their points on a coordinate plane creating a graph. They observe and analyze linear functions.
Curated OER
Systems of Linear Inequalities
In this Algebra I/Algebra II worksheet, students solve systems of linear inequalities by graphing the inequalities on a coordinate plane and determining the location of all ordered pairs that solve the system. The three page...
Curated OER
Investigating Linear Equations Using Graphing Calculator
Students investigate linear equations using the Ti-Calculator. For this algebra lesson, students graph lines and identify the different quadrants on a coordinate plane. They identify ordered pairs used to plot lines.
Curated OER
Hockey in the Middle
Students participate in passing a puck and receiving a pass. In this hockey lesson, students are divided into small groups and practice passing a puck in different directions. The lesson is based on the game of "Monkey in the Middle".
Curated OER
Cryptography Implementation
Pupils explore cryptology. They write a research paper on cryptography. Using linear equations, students invent a code and write a secret message. Pupils complete cryptography puzzles.
Curated OER
Proportionality in Tables, Graphs, and Equations
Students create different methods to analyze their data. In this algebra instructional activity, students differentiate between proportion and non-proportional graph. They use the TI-Navigator to create the graphs and move them around to...
Curated OER
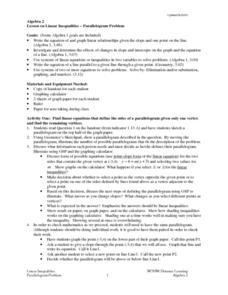
Linear Inequalities - Parallelogram Problem
Young scholars use the Geometer's Sketchpad to illustrate possible answers to a parallelogram problem. As a class, they discuss the point-slope and linear equation forms. Individually, students solve their equations and check the...
Curated OER
The Box Problem
Students create graphic, algebraic and verbal ideas of functions. In this algebra lesson, students graph functions and identify the zeros of the functions. They find the domain and range and classify functions as relation or not.
Curated OER
The Box Problem
Students investigate the concept of functions and how they are used with polynomials. They practice finding the zeros of functions and graph polynomial functions for the help of giving solutions. Students interpret the curve of a line...
Texas Instruments
Texas Instruments: X (Or Y) Marks the Spot
Students will identify x- and y-intercepts graphically. Students will calculate the slope between 2 points. Students will write the equation of a line in slope-intercept form when given the graph of the line.
Texas Instruments
Texas Instruments: Introduction to Slope and Intercepts Partner Activity
This partner activity is designed to have pre-Algebra students or Algebra 1 students compare and contrast different screen shots and begin to develop concepts needed to describe slope and intercepts.
Oswego City School District
Regents Exam Prep Center: Slopes and Equations of Lines
Explanation of linear equations and four types of slopes: positive, negative, zero, and undefined. Practice problems for the students are provided and a reinforcement activity using a graphing calculator is offered for the teacher's use.
Texas Instruments
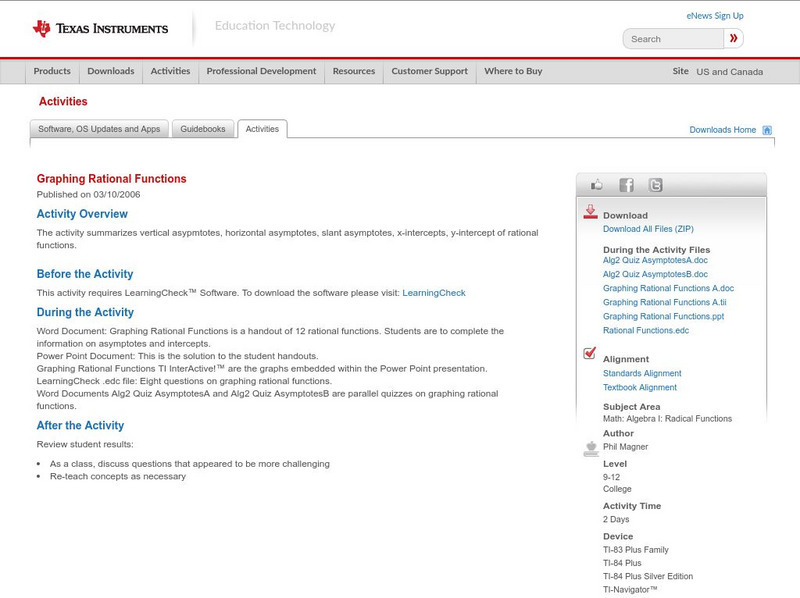
Texas Instruments: Graphing Rational Functions
The activity summarizes vertical asypmtotes, horizontal asymptotes, slant asymptotes, x-intercepts, y-intercept of rational functions.
Texas Instruments
Texas Instruments: Polynomial Function and Fitting a Curve
Students are asked to fit a polynomial function for the four given points. One y-intercept and three x-intercepts. All intercepts are given as integers. This is document that can be used as a class opener or for checking understanding.
Texas Instruments
Texas Instruments: Polynomial Functions
In this set of questions, students will find the x-intercepts of a polynomial function, factor a polynomial, and determine the number of solutions of a polynomial equation. Questions are multiple choice and true/false; solutions are...
Texas Instruments
Texas Instruments: Explore Graphs and Factors
Students use a graphing calculator to explore the relationship between the linear factors of a quadratic function and its zeros. They learn that the x-intercepts and axis of symmetry of a quadratic function can be determined from its...
Texas Instruments
Texas Instruments: Graphic Line Designs
Students can use the x- and y-intercepts to find the equations of lines and create a line design using the slope-intercept form and the limited domain of the segment.
Texas Instruments
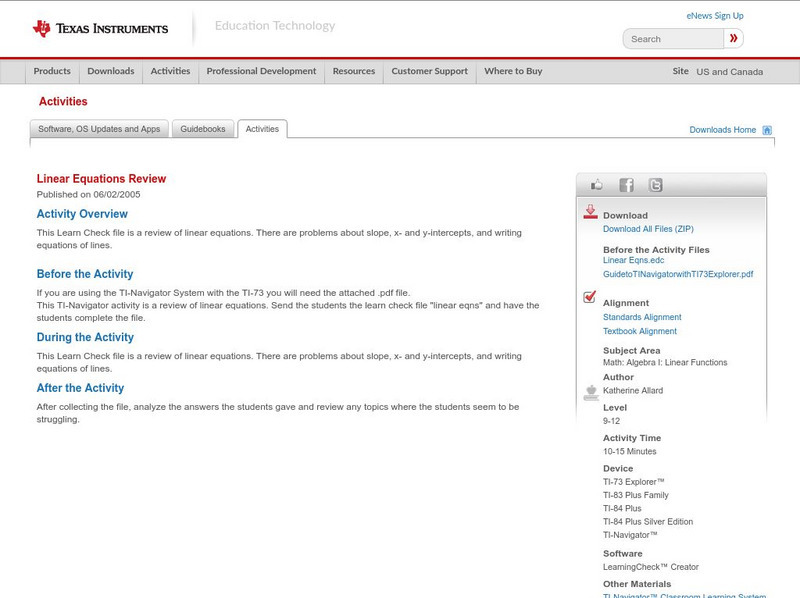
Texas Instruments: Linear Equations Review
This Learn Check file is a review of linear equations. There are problems about slope, x- and y-intercepts, and writing equations of lines.
Texas Instruments
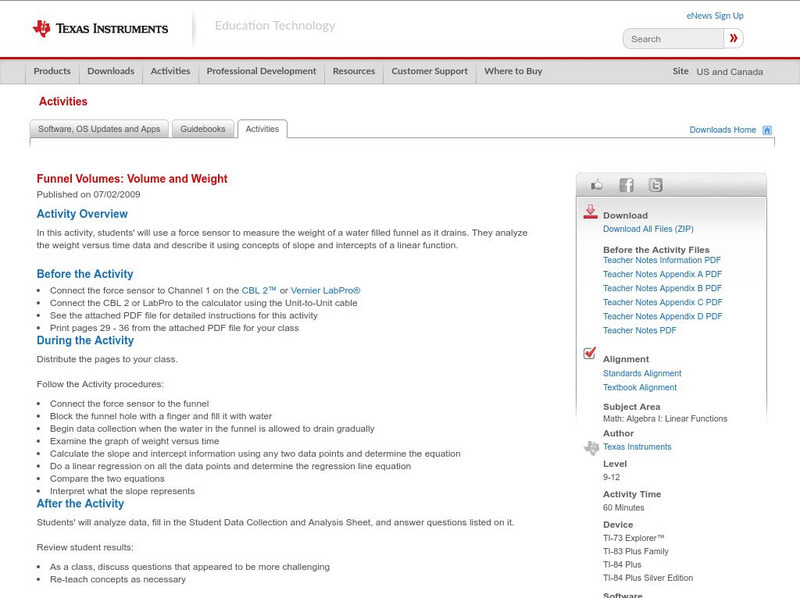
Texas Instruments: Funnel Volumes: Volume and Weight
In this activity, students' will use a force sensor to measure the weight of a water filled funnel as it drains. They analyze the weight versus time data and describe it using concepts of slope and intercepts of a linear function.
Other
Desmos: Linear Bundle
A collection of activities where students investigate linear equations. Activities involve an exploration of the lines in a polygraph and the vocabulary needed to describe them accurately; the slope in graphs; lines in different...
Texas Instruments
Texas Instruments: Rational Functions
In this set of questions, students are asked to investigate rational functions to find vertical, horizontal, and oblique asymptotes as well as x- and y-intercepts. Questions are multiple choice and true/false with solutions provided.
Analyze Math
Analyze Math: Logarithmic Functions (1)
Learners explore the properties of logarithmic functions. The activity consists of examples with detailed solutions.


