Curated OER
Conics and Graphing
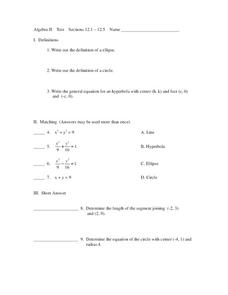
In this algebra worksheet, students solve equations by graphing an ellipse, circle and hyperbola. They match equations to graphs and define each type of function. There are 20 questions total.
Curated OER
Worksheet 14
In this algebra instructional activity, 11th graders solve two problems where they must determine volume using the cylindrical shells method. This would be a great review sheet or warm up.
Curated OER
Linear and Quadratic Approximations
Students explore a linear, a parabolic, and a log function. In this Algebra II/Pre-calculus instructional activity students investigate the graph a line, a parabola, and a log function. Students examine the three graphs as they compare...
Curated OER
A Second View of Polar Coordinates
In this polar coordinates worksheets, students change ordered pairs from rectangular form to polar form. They plot and label points and identify alternative coordinate pairs for given points. There are approximately 20 problems on this...
Curated OER
Evaluating Definite Integrals Using Accumulation
For this integral worksheet, students sketch functions and use their graph to evaluate functions. This two-page worksheet contains four multi-step problems.
Curated OER
Electromagnetic Radiation and the Bohr Atom
In this light worksheet, students calculate the frequency and wavelength. Students practice applying Planck's constant and determining the energy of a photon. This worksheet has 9 problems to solve.
Curated OER
Plotting Points
In this coordinate pairs worksheet, students learn to plot points on a graph. Students study the examples and then complete 20 questions. This is intended as an online activity, but may be completed with pencil and paper.
Curated OER
Compound Locus
In this compound locus learning exercise, 10th graders solve and complete 10 different problems that include compound locus. First, they determine the number of points in a plane given the units from a given line and a point on the line....
Curated OER
Quiz: Translations and Vectors
In this translation and vector worksheet, students graph and label translations of polygons and points. Translation instructions are given as ordered pairs, as well as in written words. This one-page worksheet contains ten problems.
Curated OER
Straight Graph Lines: Coordinates
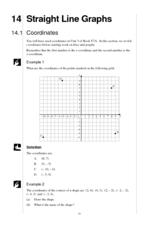
Young scholars access prior knowledge of coordinates. In this coordinates lesson, students graph coordinate points to create a symmetrical figure and of a straight line. Young scholars complete several practice examples.
Curated OER
Spaghetti Bridges
Students thread a piece of spaghetti through the holes in the cup. One person suspend the cup by placing each index finger approximately one inch in from the ends of the spaghetti.
Curated OER
Spaghetti Bridges
Eighth graders experiment with building bridges of spaghetti, pennies, and a cup to determine how varying the number of spagetti pieces affects the strength of the bridge. They graph their results and interpret the data.
Curated OER
Exploring Area/Perimeter Through Coordinate Geometry
Students explore area and perimeter through coordinate geometry using student literature, hands-on manipulatives, and the Internet.
Curated OER
Chronic Conics
Fourth graders use two activities to draw four different conic sections. One activity is of a physical nature and one is traditional paper and pencil.
Curated OER
Rising Water
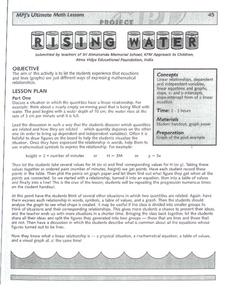
Eighth graders discuss a situation with quantities that relate in a linear fashion. They discuss ways to determine the relationship. Students represent this relationship with mathematic symbols. Students discuss the meaning of...
Curated OER
Linear Systems: Identifying Pivots and Multipliers
In this identifying pivots worksheet, learners use algebra to find equivalent systems of equations. This four-page worksheet contains examples, explanations and approximately ten problems.
Curated OER
Linear Systems: Identifying Pivots and Multipliers
In this pivot worksheet, students explore the elimination process, and write a matrix in upper triangular form. They identify equivalent systems. This four-page worksheet contains examples, explanations, and approximately ten problems.
Curated OER
Squares
In this squares worksheet, 10th graders solve and complete 7 various types of problems. First, they divide a product of one with a square of the other. Then, students find the dimensions of a rectangle that will maximize the area. In...
Curated OER
Properties of Logarithms
Students explore the concept of logarithms. In this logarithms instructional activity, students graph logarithms on their Ti-Nspire calculator. Students describe the shapes of their graphs by identifying slope, y-intercepts, and...
Curated OER
Chart the Stars
Seventh graders find constellation distances and plot the stars. In this star lesson, 7th graders plot the star points for Canis Major. Students use graphing calculators to graph the constellation. Students choose another constellation...
Curated OER
Properties of a Parabola
In this algebra instructional activity, students identify the properties of a parabola. They factor and graph quadratic equations. There are 18 questions.
Curated OER
Lab Report Template
Students write a paragraph (complete sentences) which explains what they did in the lab.
Curated OER
Suicides And Suicide Rates
Students investigate suicide using a variety of criteria and create a bar graph before discussing the results as a class.
Curated OER
Creating Line Graphs
Students relate data to coordinate graphs and plot points on this graph. They use minimum wage data to construct the graph. Students decide appropriate time intervals for the graphs. They share graphs with their classmates.


