Curated OER
Graphing Exponentials
Bring your Algebra class to the computer lab! Using materials created by Texas Instruments, they explore exponentiasl and graphs. Be sure to download the correct materials (on the right side of the webpage) before having them walk...
Curated OER
What Functions do Two Graph Points Determine?
Your algebra learners write linear, exponential, and quadratic equations containing the same two graph points in this collaborative task.
Curated OER
Graphs and Transformations of Functions
Is it possible to solve quadratic equations by factoring? It is, and your class will graph quadratic equation and functions too. They perform transformation on their graphs showing increasing and decreasing intervals, domain, and range....
Virginia Department of Education
Rational Functions: Intercepts, Asymptotes, and Discontinuity
Discover different patterns by making connections between a rational function and its graph. An engaging lesson asks scholars to explore the behavior of different rational functions. Groups discover a connection between the function and...
Curated OER
Writing Linear Equations in Slope-Intercept Form
In this math worksheet, learners are given three lines graphed on a coordinate grid. Students identify the slope, intercepts, and write an equation for each. Learners find the intercepts of a linear equation, and graph them. They write...
Curated OER
Graphs of Quadratic Functions Section 11.6
In this graphing worksheet, students graph quadratic functions. They identify the maximum and minimum value of the function, determine the line of symmetry, and locate the vertex. Coordinate planes are provided for each function. There...
Alabama Learning Exchange
We Love to Graph!
Students experience graphing points. In this graphing points lesson, students play an on-line game where they must name 10 coordinate pairs correctly. Students play a maze game where they maneuver a robot using coordinate pairs. ...
Illustrative Mathematics
Find the Change
This exercise is an opportunity for algebra learners to understand the connection between the slope of a line and points found on the line. Use similar triangles to explain why slope m is the same between any two points. Discuss with the...
Curated OER
Hybrid Vehicles: Cut Pollution and Save Money
Math and science meet in this lesson on hybrid electric automobiles. This 24-page resource provides everything you need for teaching a lesson that compares the use of internal combustion engines to hybrid electric engines. Participants...
West Contra Costa Unified School District
Graphing Systems
Get hands on with solving systems of equations graphically. A solid lesson plan uses guided practice to show how to solve systems of linear equations. It allows time for sharing ideas and provides a printable matching activity to promote...
Curated OER
Basic Algebra and Computers: Spreadsheets, Charts, and Simple Line Graphs
Young scholars, while in the computer lab, assess how to use Microsoft Excel as a "graphing calculator." They view visual representations of line graphs in a Cartesian plane while incorporating basic skills for using Excel productively.
Curated OER
Graphing Linear Equations
Students graph linear equations. In this algebra lesson, students perform transformation on linear equations. They identify the slope and y-intercept of each line.
Curated OER
The "U's" Have IT!
Students explore the maximum and minimum values of parabola. In this exponential equations instructional activity, students use graphing calculators or TI Interactive Software to calculate values of parabola and graph x-intercepts of...
Curated OER
Stretching the Quads
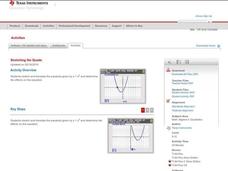
Explore parabolas in this algebra lesson with the graphing calculator. The class investigates what effects the changing of the parameters of the vertex form of a quadrati have to its graph. They find the zeros of a quadratic graphically...
Illustrative Mathematics
DVD Profits, Variation 1
The idea in the resource is to understand the connections between proportional relationships, lines, and linear equations. To stay within the context of the standard, skip the part of the resource that solves with unit rates. Instead,...
Curated OER
Linear Functions
Your learners will explore linear functions by analyzing a graph of the linear equations.Then learners analyze through calculating f(x+P) and g(x+p)
Wordpress
Introduction to Exponential Functions
This lesson begins with a review of linear functions and segues nicely over its fifteen examples and problems into a deep study of exponential functions. Linear and exponential growth are compared in an investment task. Data tables are...
Curated OER
Graphing Linear Equations Using Data Tables
Students review the Cartesian plane and the process of plotting points. In groups, students create tables, identify the slope and y-intercept, and graph the equation. Afterward, students perform the same process, only, individually. As a...
Curated OER
Slope, slope-Intercept Form and Standard Form
Students investigate and solve linear equations using slopes. In this algebra lesson, students graph lines using the slope and y intercept. They also find the slope by rewriting their equation in to slope-intercept form from standard form.
Curated OER
Slopes, Slope-Intercept Form, Standard Form
Students identify the slope of an equation using various methods. In this algebra lesson, students graph linear equations and calculate the slopes using the x and y intercept to solve the equations and graph the lines. They use the slope...
Curated OER
Lessen the Loan
Middle-schoolers explore the concept linear equations. They use the internet to navigate through videos and problems. Pupils problem solve to determine rates of change, slope, and x and y-intercepts.
Curated OER
Standard Linear Form
Ninth graders identify and describe the x-intercept as the place where the line crosses the x-axis as it applies to football. They create their own differentiations to reinforce the distinction between the x-intercept and the...
Curated OER
Point-Slope Form
Ninth graders explore the point-slope form of linear equations and graph lines in the point-slope form. After completing the point-slope equation, they identify the slope of a line through a particular point. Students explain the...
Curated OER
Introducing Linear Terminology
Ninth graders graph linear equations and inequalities in two variables and then, they write equations of lines and find and use the slope and y-intercept
of lines. They use linear equations to model real data and define to define the...


