Texas Instruments
Texas Instruments: The Standard Form of a Quadratic Equation
In this activity, students explore the standard form of a quadratic equation, y = ax 2 + bx + c. They explore how the x-intercepts (zeros), y-intercept, and vertex are related to the graph of the standard form of a quadratic function.
CK-12 Foundation
Ck 12: Algebra: Quadratic Functions and Their Graphs
[Free Registration/Login may be required to access all resource tools.] This lesson covers how to find the x-intercepts, vertex, axis of symmetry, and y-intercept of a parabola.
Texas Instruments
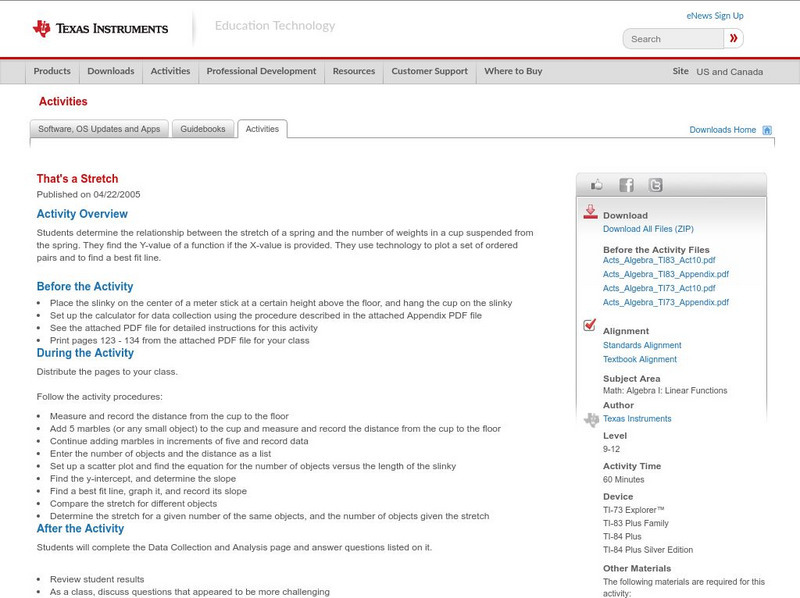
Texas Instruments: That's a Stretch Ti 83
Students determine the relationship between the stretch of a spring and the number of weights in a cup suspended from the spring. They find the Y-value of a function if the X-value is provided. They use technology to plot a set of...
Illustrative Mathematics
Illustrative Mathematics: 8.ee Find the Change
In this task, 8th graders work with linear functions and learn how to discuss and make calculations with slope and x- and y-intercepts. Aligns with 8.EE.B.
Texas A&M University
Wtamu Virtual Math Lab: Beginning Algebra: Graphing Linear Inequalities
A tutorial on how to graph a linear inequality in two variables. The tutorial offers step-by-step instruction and examples of how to graph linear inequalities.
Northeast Parallel Architectures Center, Syracuse University
Npac Reu Program: Graphing With Coordinates in the Plane
This site from the Northeast Parallel Architectures Center, Syracuse University provides a good five-part basic graphing instructor. Covers all the basics clearly. It is divided into links for easier navigation.
ClassFlow
Class Flow: Definition of Slope
[Free Registration/Login Required] Presents the definition of slope and the formulas for y-intercept form.
Windstream
Ojk's Precalculus Study Page: Functions of Two Variables
An introduction to functions with two variables, including several examples relating to linear programming. The tutorial includes graphical examples of the functions and also review questions located at the bottom of the page.
ClassFlow
Class Flow: Straight Lines
[Free Registration/Login Required] Students explore straight lines, graphing lines and applying the formula for graphing linear equations.
Paul Dawkins
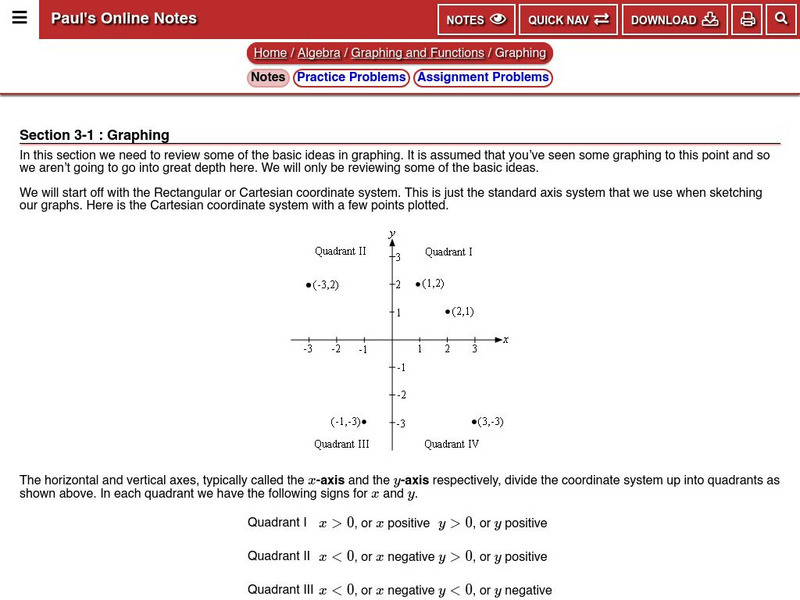
Paul's Online Notes: Algebra: Graphing
Detailed math tutorial features notes and examples that take a look at the Cartesian (or Rectangular) coordinate system. Provides definitions of ordered pairs, coordinates, quadrants, and x and y-intercepts.
Concord Consortium
Seeing Math: Function Analyzer
The Function Analyzer allows learners to see the connections among three representations of a function: symbolic, area, and graphic. In addition, by allowing learners to change the value of four elements of a function - the coefficient...
CK-12 Foundation
Ck 12: Analysis: Graphs of Polynomials Using Zeros
[Free Registration/Login may be required to access all resource tools.] In this lesson students use ''X'' and ''Y'' intercepts to graph polynomials of 3rd degree or higher. Students examine guided notes, review guided practice, watch...
Interactive Mathematics
Interactive Mathematics: More on Curve Sketching
Examples are presented to demonstrate the steps for sketching curves that are not polynomials. Using x- and y-intercepts, limits, domain and range, maxima and minima, second derivatives and general behavior the graphs are constructed...
Interactive Mathematics
Interactive Mathematics: Curve Sketching
Sketches of functions are drawn by determing important points: x- and y-intercepts, local maxima and minima, and point of inflection. The general shapes of specific functions are illustrated to help identify characteristics of each type...
Other popular searches
- X and Y Intercepts
- Finding X and Y Intercepts
- X and Y Intercepts
- X & Y Intercepts
- X and Y Intercepts
- Graph Using X and Y Intercepts
- Finding the X and Y Intercepts
- X Y Intercepts Graphing
- X Y Intercepts
- Graph X and Y Intercepts
- Graphing X and Y Intercepts
- X and Y Intercepts


