Texas Education Agency
Texas Gateway: Kinematics: Graphical Analysis of One Dimensional Motion
By the end of this section, you will be able to describe a straight-line graph in terms of its slope and y-intercept, determine average velocity or instantaneous velocity from a graph of position vs. time, determine average or...
Texas Education Agency
Texas Gateway: The Language of Physics: Physical Quantities and Units
By the end of this section, you will be able to associate physical quantities with their International System of Units (SI) and perform conversions among SI units using scientific notation; relate measurement uncertainty to significant...
Wolfram Research
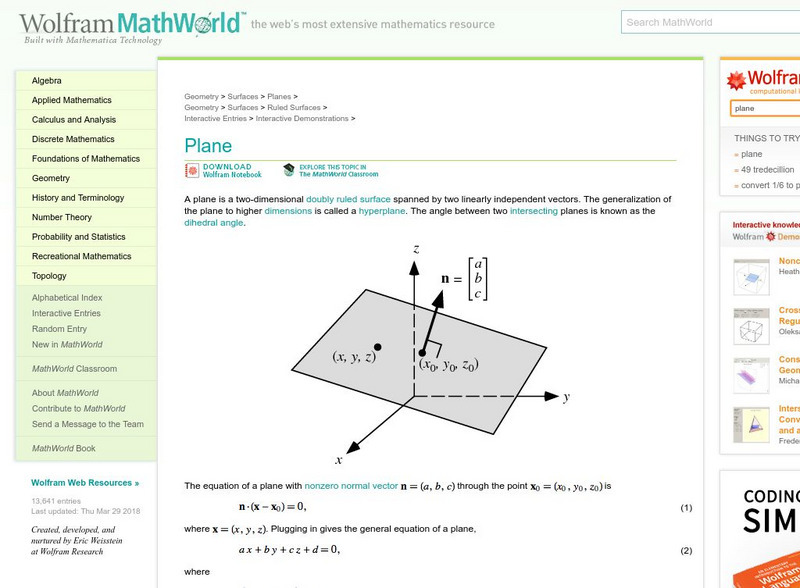
Wolfram Math World: Plane
This site defines a plane in terms of geometric surfaces. Content includes formulas for a plane using the normal vector, how to find the x, y, and z intercepts of a plane, distance from the origin, point plane distance formula, dihedral...
Varsity Tutors
Varsity Tutors: Hotmath: Practice Problems: Graphing Linear Equations
Twenty-one problems present a variety of practice graphing linear equations. They are given with each step to the solution cleverly revealed one at a time. You can work each step of the problem then click the "View Solution" button to...
University of South Florida
Fcat: Spaghetti Bridges: Teacher Notes
Students build bridges and test their strength to collect data and write an equation. The concept of slope is explored in this activity.
Other
Desmos: Linear Bundle
A collection of activities where students investigate linear equations. Activities involve an exploration of the lines in a polygraph and the vocabulary needed to describe them accurately; the slope in graphs; lines in different...
Texas Education Agency
Texas Gateway: Solving Quadratic Equations Using Graphs
Given a quadratic equation, the student will use graphical methods to solve the equation.
Texas A&M University
Wtamu Virtual Math Lab: College Algebra: Domain, Range, Vertical Line Test
A detailed tutorial on functions covering the following topics: finding the domain and range of a function, using the vertical line test, determining whether a function is even, odd, or neither, and applying the greatest integer function...
Texas Education Agency
Texas Gateway: Analyzing Graphs of Quadratic Functions
Given the graph of a situation represented by a quadratic function, the student will analyze the graph and draw conclusions.
TeachEngineering
Teach Engineering: Linear Equations Game
Students groups act as aerospace engineering teams competing to create linear equations to guide space shuttles safely through obstacles generated by a modeling game in level-based rounds. Each round provides a different configuration of...
Texas Education Agency
Texas Gateway: Tea Statistics: The Regression Equation
A tutorial on how to find the line of best fit or least-squares regression line for a set of data in a scatter plot using different methods and calculations.
Texas Instruments
Texas Instruments: The Standard Form of a Quadratic Equation
In this activity, students explore the standard form of a quadratic equation, y = ax 2 + bx + c. They explore how the x-intercepts (zeros), y-intercept, and vertex are related to the graph of the standard form of a quadratic function.
Texas Instruments
Texas Instruments: Step Up
Students learn to use measurements on a real model to develop the concept of slope and linear functions. They use a calculator to explore changing the slopes and Y- intercepts in the slope intercept form Y = MX + B.
CK-12 Foundation
Ck 12: Algebra: Quadratic Functions and Their Graphs
[Free Registration/Login may be required to access all resource tools.] This lesson covers how to find the x-intercepts, vertex, axis of symmetry, and y-intercept of a parabola.
Concord Consortium
Seeing Math: Function Analyzer
The Function Analyzer allows learners to see the connections among three representations of a function: symbolic, area, and graphic. In addition, by allowing learners to change the value of four elements of a function - the coefficient...
Texas Instruments
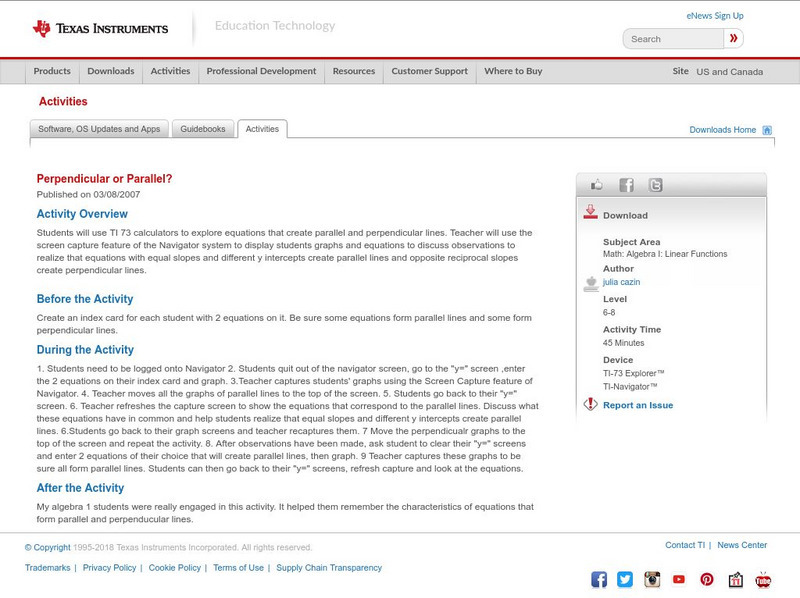
Texas Instruments: Perpendicular or Parallel?
Students can use TI 73 calculators to explore equations that create parallel and perpendicular lines. Teacher will use the screen capture feature of the Navigator system to display students graphs and equations to discuss observations to...
Texas Instruments
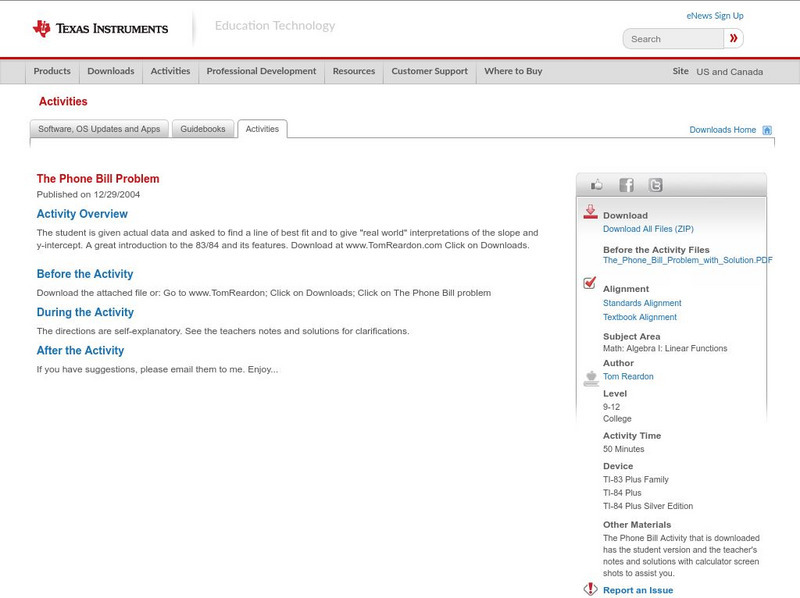
Texas Instruments: The Phone Bill Problem
The student is given actual data and asked to find a line of best fit and to give "real world" interpretations of the slope and y-intercept. A great introduction to the 83/84 and its features.
Texas Instruments
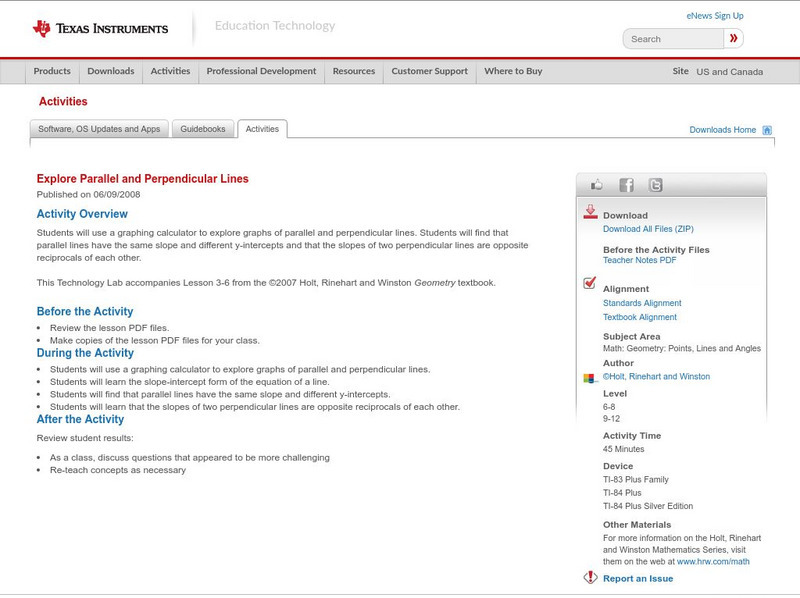
Texas Instruments: Explore Parallel and Perpendicular Lines
Students can use a graphing calculator to explore graphs of parallel and perpendicular lines. Students will find that parallel lines have the same slope and different y-intercepts and that the slopes of two perpendicular lines are...
Mangahigh
Mangahigh: Algebra: Recognize the Equations of Common Curves
Students recognize and know the sketches of quadratics, cubics and recipricols including the shape of positive and negative functions and the interpretation of their y-intercepts.
CK-12 Foundation
Ck 12: Algebra: Forms of Linear Equations
[Free Registration/Login may be required to access all resource tools.] Write linear equations in standard form and find the slope and y-intercept of such lines.
Khan Academy
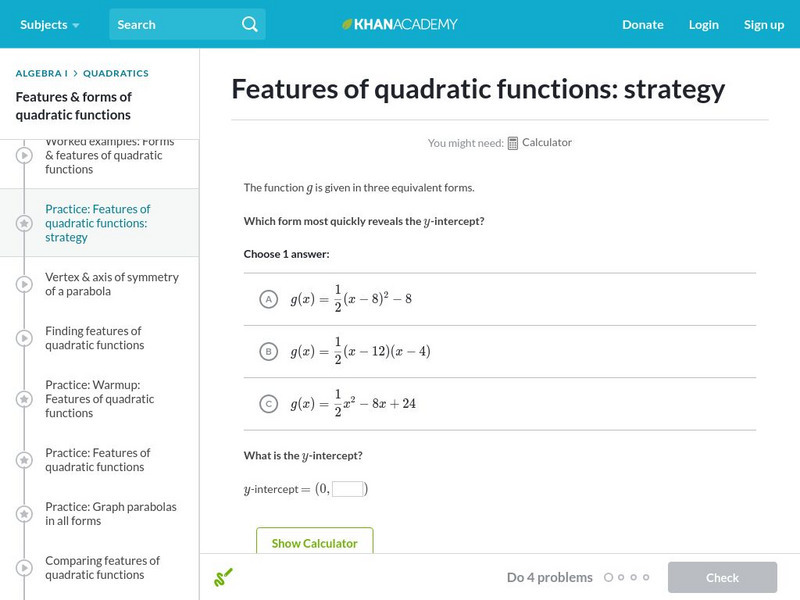
Khan Academy: Features of Quadratic Functions: Strategy
Identify the form of a quadratic function that immediately reveals a given feature of that function. Features in question are the y-intercept of the graph, the zeroes ("roots") of the function, and the vertex of the parabola. Students...
CK-12 Foundation
Ck 12: Analysis: Graphs of Polynomials Using Zeros
[Free Registration/Login may be required to access all resource tools.] In this lesson students use ''X'' and ''Y'' intercepts to graph polynomials of 3rd degree or higher. Students examine guided notes, review guided practice, watch...
Council for Economic Education
Econ Ed Link: Taxes and Income
Use this interactive graph to gain an understanding of how taxes increase as your income goes up. The y-intercept line shows the base tax amount for no income.
Alabama Learning Exchange
Alex: Math Is Functional
This lesson is a technology-based activity in which students extend graphing of linear functions to the use of spreadsheet software. After students have become proficient in constructing a table of values, students are able to...
Other popular searches
- X and Y Intercepts
- Finding X and Y Intercepts
- X and Y Intercepts
- Slopes and Y Intercepts
- X & Y Intercepts
- X and Y Intercepts
- Slope and Y Intercepts
- Graph Using X and Y Intercepts
- Finding the X and Y Intercepts
- X Y Intercepts Graphing
- Slope and Y Intercepts
- X Y Intercepts
