Hi, what do you want to do?
Incorporated Research Institutions for Seismology
Iris: Volcano Monitoring: Using in Sar to See Changes in Volcano Shape
Probe into the technique used to measure ground deformation indicative of volcanic activity. Check out this quick clip illustrating the function of InSAR and how it helped identify activity in Oregon. [0:42]
Incorporated Research Institutions for Seismology
Iris: Volcano Monitoring: Volcanic Earthquakes
Find the connection between earthquakes and volcanoes. This clip will illustrate volcanic earthquakes. [1:44]
Incorporated Research Institutions for Seismology
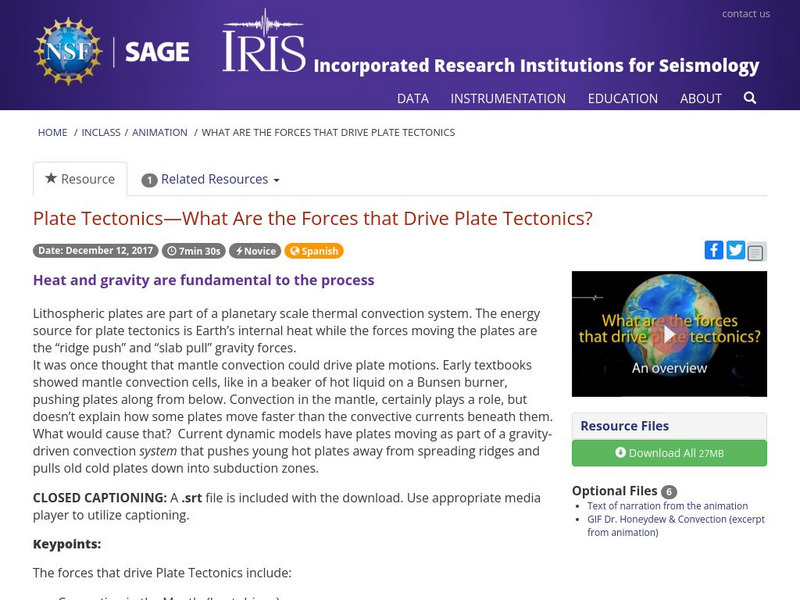
Iris: Thermal Convection: What Are the Forces That Drive Plate Tectonics?
Video introduces mantle convection which is the slow creeping motion of Earth's solid silicate mantle caused by convection currents carrying heat from the interior of the Earth to the surface. It goes on to explain how the Earth's...
Incorporated Research Institutions for Seismology
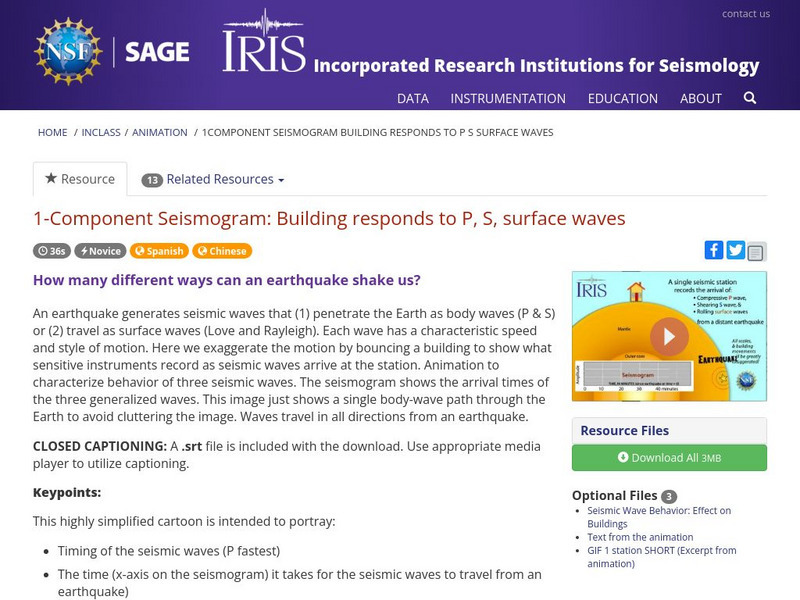
Iris: 1 Component Seismogram: Building Responds to P, S, Surface Waves
Seismic waves travel through the earth to a single seismic station. Scale and movement of the seismic station are greatly exaggerated to depict the relative motion recorded by the seismogram as P, S, and surface waves arrive. [0:50]
Incorporated Research Institutions for Seismology
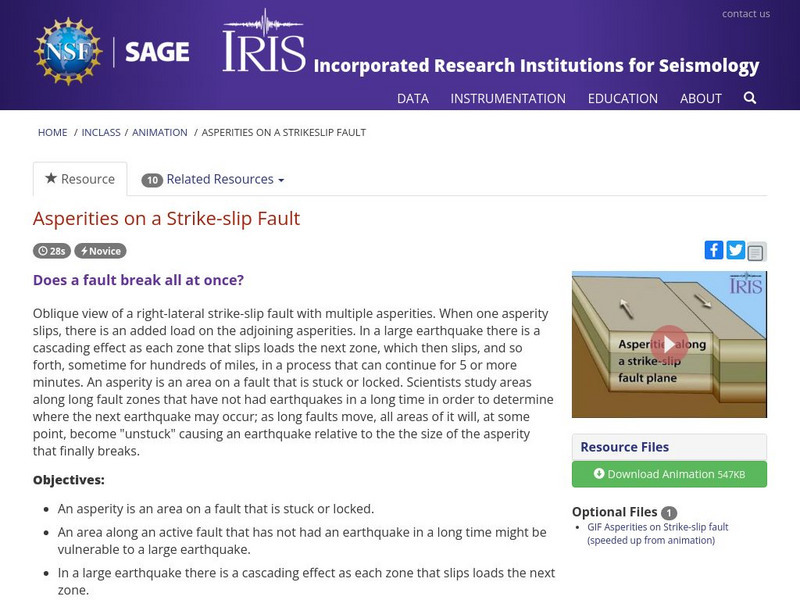
Iris: Asperities on a Strike Slip Fault
An asperity is an area on a fault that is stuck or locked. This brief clip illustrates asperities along a strike-slip fault plane. [0:28]
Incorporated Research Institutions for Seismology
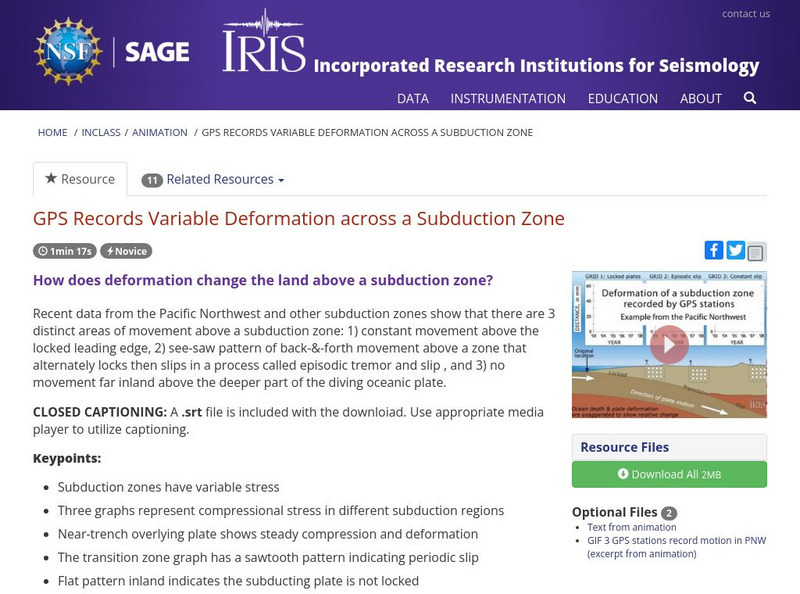
Iris: Gps Records Variable Deformation Across a Subduction Zone
Animation shows deformation in three zones above a subduction zone as recorded by GPS stations. [1:17]
Incorporated Research Institutions for Seismology
Iris: Lidar: Airborn Light Detection and Ranging
In this video animation, airborne LIDAR is used to measure land-surface elevations hidden amid vegetation in Lake Tahoe. [2:08]
Incorporated Research Institutions for Seismology
Iris: Liquefaction During the 1906 San Francisco Earthquake
Animation shows how liquefaction of compacted sediment in the San Francisco area led to the tilting of houses during the 1906 earthquake. [0:43]
Incorporated Research Institutions for Seismology
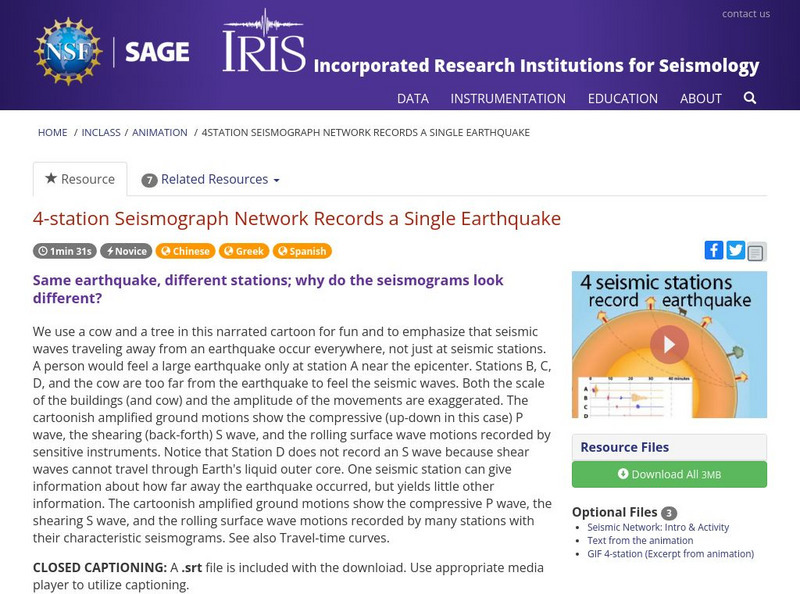
Iris: 4 Station Seismograph Network Records a Single Earthquake
See a cow and a tree in this narrated cartoon for fun and to emphasize that seismic waves traveling away from an earthquake occur everywhere, not just at seismic stations. [1:31]
Incorporated Research Institutions for Seismology
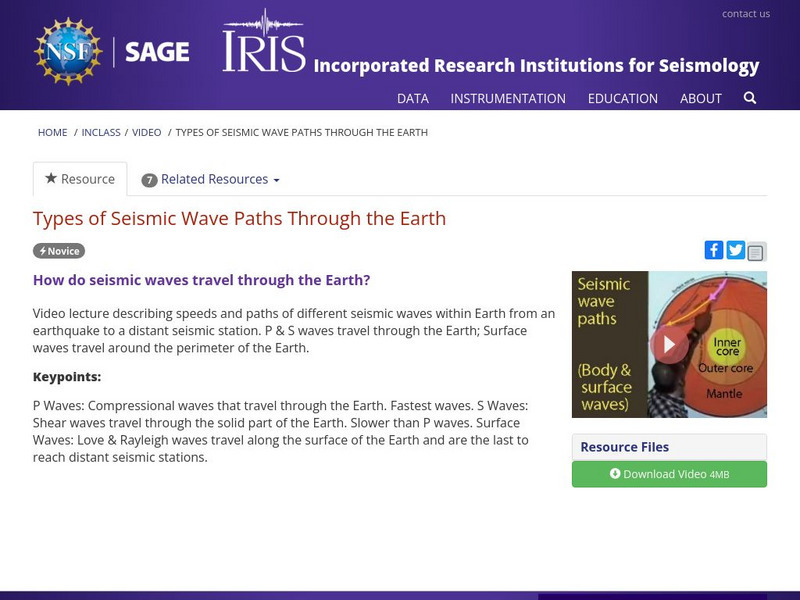
Iris: Types of Seismic Wave Paths Through the Earth
Video lecture describing speeds and paths of different seismic waves within Earth from an earthquake to a distant seismic station. P & S waves travel through the Earth; Surface waves travel around the perimeter of the Earth. [1:44]
Incorporated Research Institutions for Seismology
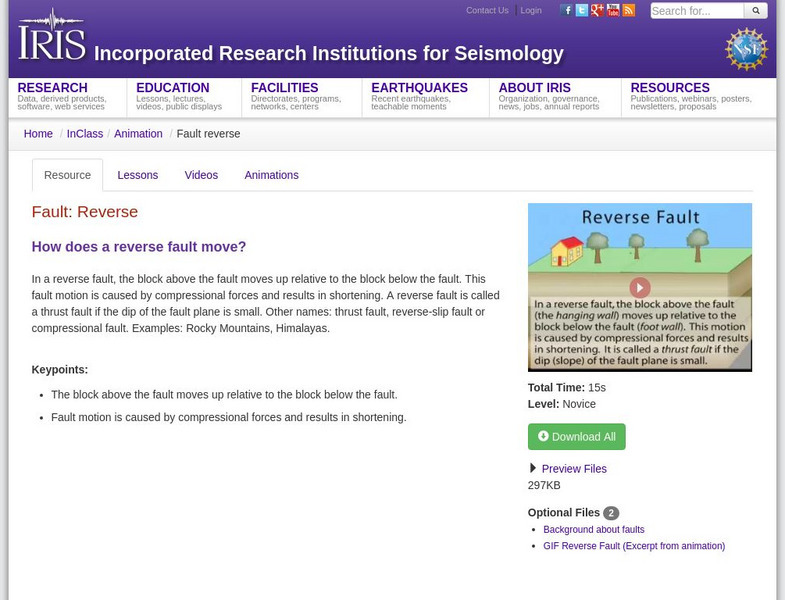
Iris: Earthquake Gi Fs
Two animated GIFs of a reverse fault and station seismogram teachers can use for a presentation.
Incorporated Research Institutions for Seismology
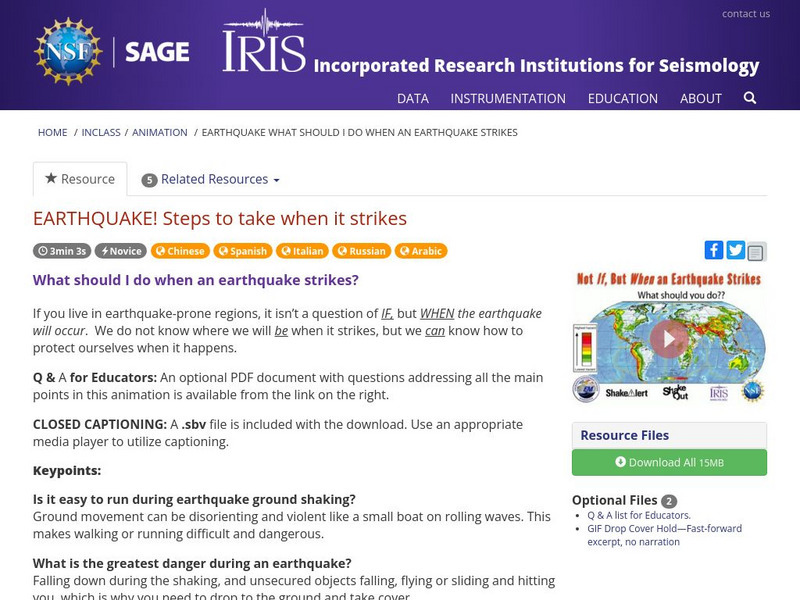
Iris: Earthquake! Steps to Take When It Strikes
A video guide for steps to take during an earthquake. [3:04]
Incorporated Research Institutions for Seismology
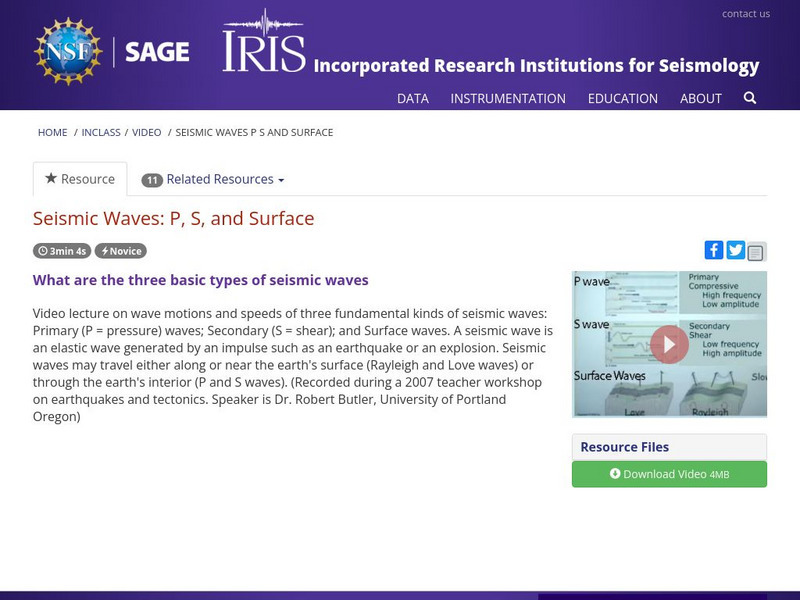
Iris: Seismic Waves: P, S, and Surface
Video lecture on wave motions and speeds of three fundamental kinds of seismic waves: Primary (P = pressure) waves; Secondary (S = shear); and Surface waves. [3:10]
Incorporated Research Institutions for Seismology
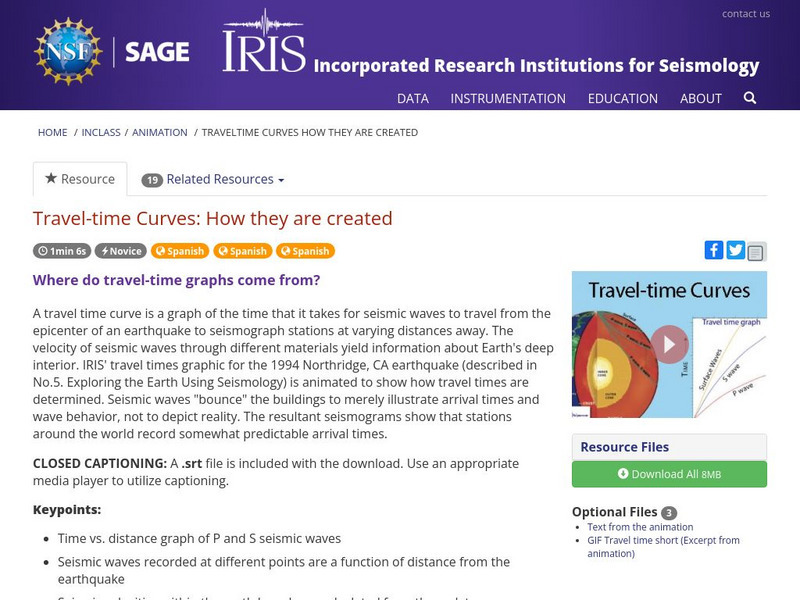
Iris: Travel Time Curves: How They Are Created
See how travel-time curves are created. [2:52]
Incorporated Research Institutions for Seismology
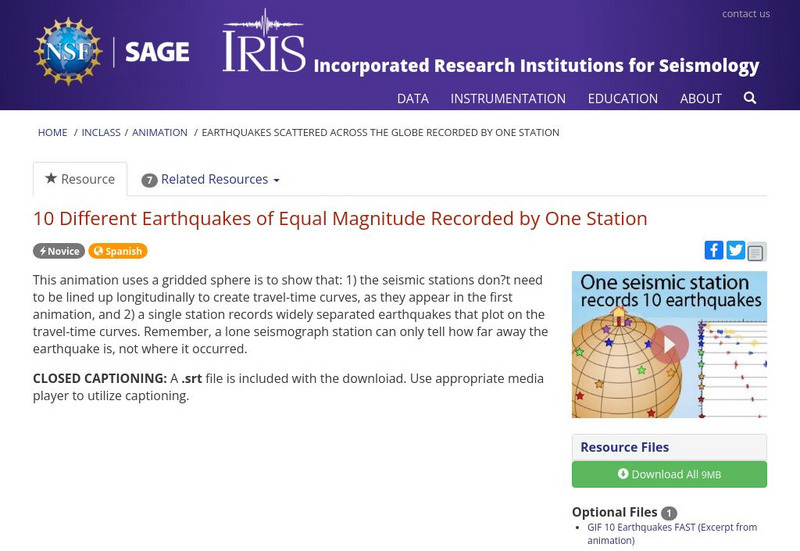
Iris: 10 Different Earthquakes of Equal Magnitude Recorded by One Station
This animation uses a gridded sphere is to show that: 1) the seismic stations don't need to be lined up longitudinally to create travel-time curves, as they appear in the first animation, and 2) a single station records widely separated...
Incorporated Research Institutions for Seismology
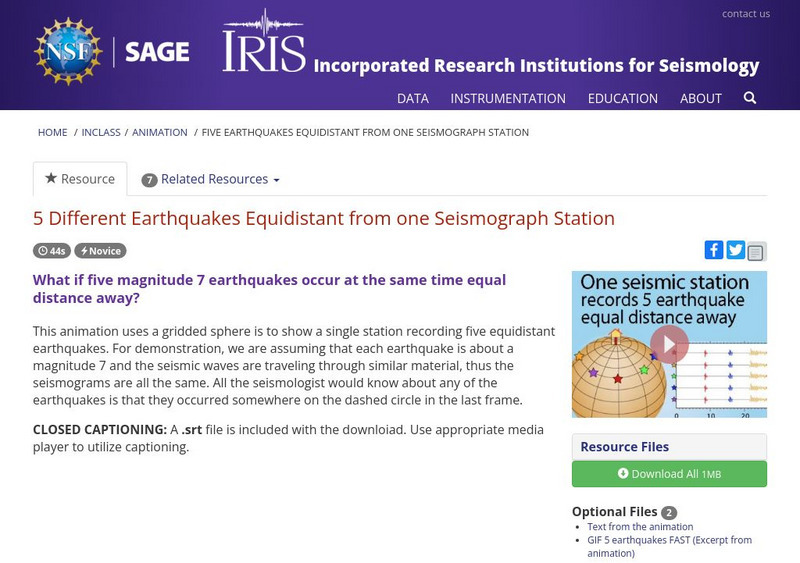
Iris: 5 Different Earthquakes Equidistant From One Seismograph Station
This animation uses a gridded sphere is to show a single station recording five equidistant earthquakes. [0:44]
Incorporated Research Institutions for Seismology
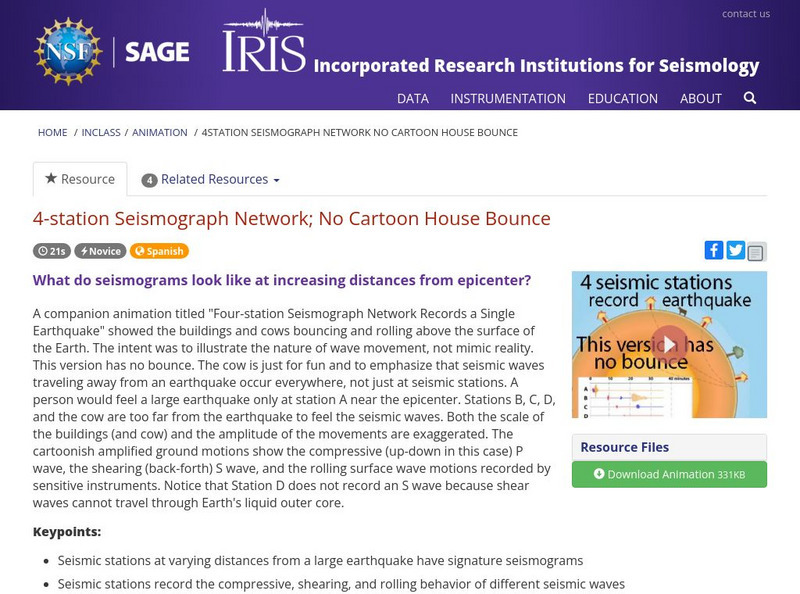
Iris: 4 Station Seismograph Network; No Cartoon House Bounce
See what seismograms look like at increasing distances from the epicenter. [0:21]
Incorporated Research Institutions for Seismology
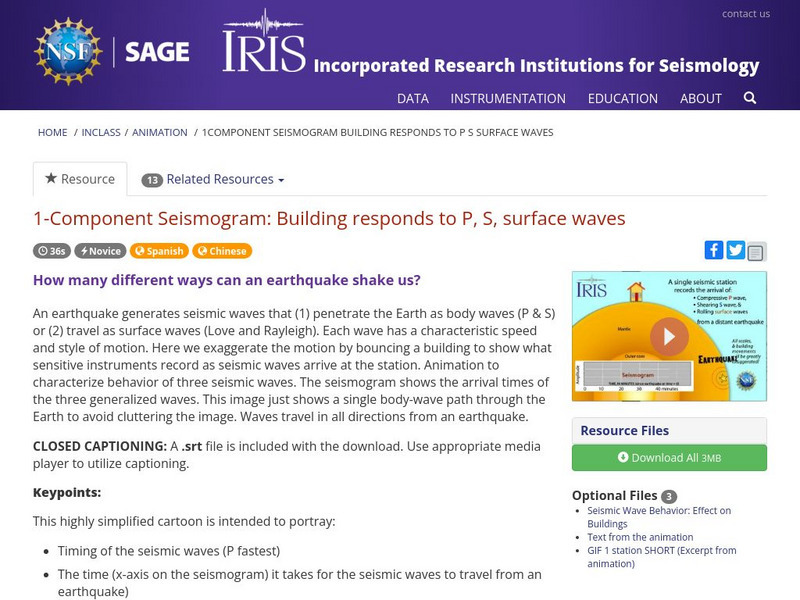
Iris: 1 Component Seismogram: Building Responds to P, S, Surface Waves
See how surface waves and P and S-Waves affect Earth's surface. [0:36]
Incorporated Research Institutions for Seismology
Iris: Magnitude Perspective: Graphical Comparison of Earthquake Energy Release
See this graphical comparison of earthquake energy released by historical earthquakes. [1:52]
Incorporated Research Institutions for Seismology
Iris: Magnitude Explained: Moment Magnitude vs. Richter Scale
Scientists have developed far-more sensitive seismometers that, with faster computers, have enabled them to record & interpret a broader spectrum of seismic signals than was possible in the 1930's, when the Richter magnitude was...
Incorporated Research Institutions for Seismology
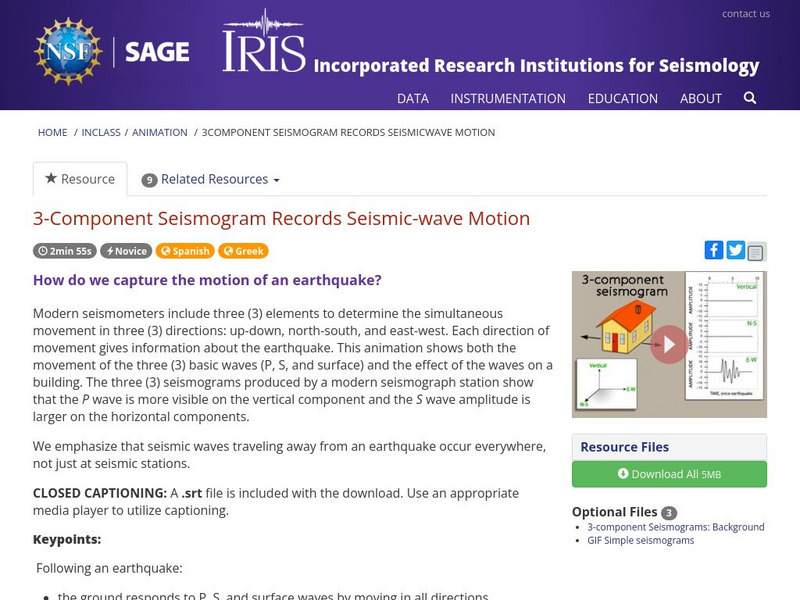
Iris: 3 Component Seismogram Records Seismic Wave Motion
See how a 3-Component seismogram records seismic-wave motion. [2:53]
Incorporated Research Institutions for Seismology
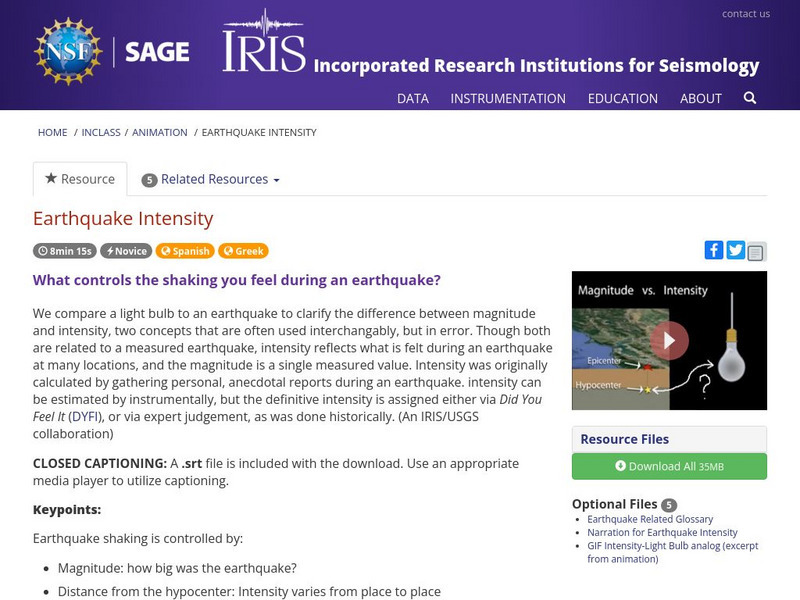
Iris: Earthquake Intensity
Understand the three factors that affect earthquake intensity: magnitude, distance from the center, and Local rock and soil conditions. [8:15]
Incorporated Research Institutions for Seismology
Iris: Using Seismographs to Study Hurricanes
See how a seismograph can help determine the strength of a hurricane. [5:19]
Incorporated Research Institutions for Seismology
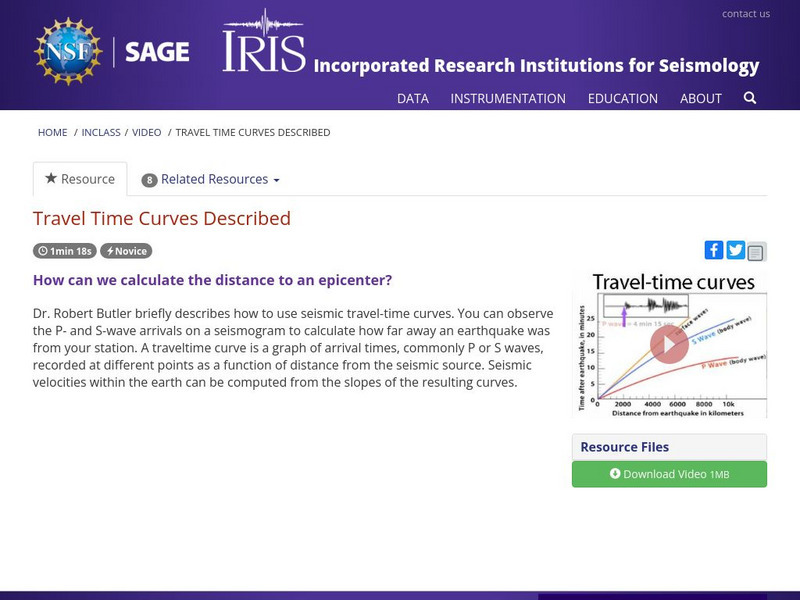
Iris: Travel Time Curves Described
Learn how we can calculate the distance to an epicenter of an earthquake. [1:19]


