Hi, what do you want to do?
Virtual Nerd
Virtual Nerd: What's the Power of a Power Rule?
How do you solve a problem with an exponent raised to another exponent? Watch this video for step by step instructions and examples. [5:40]
Virtual Nerd
Virtual Nerd: What's the Quotient of Powers Rule?
Watch how exponents add when you divide the same number raised to different exponents. Reviewing the quotient of powers rule will help you on the SAT! [5:20]
Virtual Nerd
Virtual Nerd: What's the Product of Powers Rule?
Watch how exponents add when you multiply the same number raised to different exponents. Reviewing the product of powers rule will help you on the SAT! [4:30]
Virtual Nerd
Virtual Nerd: How Do You Find the Quotient of Powers With Variables?
Watch how to simplify an expression using the quotient of powers rule. This tutorial will explain the process and show examples. [2:58]
Virtual Nerd
Virtual Nerd: How Do You Evaluate Negative Exponents?
How do you simplify expressions that have negative exponents? This video will walk you through the process and provide examples. [3:39]
Virtual Nerd
Virtual Nerd: How Do You Find the Product of Powers?
Review how to use the product of powers rule to simplify an expression. This tutorial will walk you through the process and show you examples. [3:22]
Virtual Nerd
Virtual Nerd: How Do You Make a Box and Whisker Plot?
To help you visualize data, a Box-and-Whisker Plot is one method you can use. Watch this tutorial to see what it looks like and how to make one. [6:46]
Virtual Nerd
Virtual Nerd: What Is a Box and Whisker Plot?
Learn how a Box-and-Whisker plot is an effective way to interpret data. This tutorial will explain and show examples of Box-and-Whisker plots. [5:35]
Virtual Nerd
Virtual Nerd: What Is the Interquartile Range?
The interquartile range is the middle 50% of a data set. Watch this tutorial to learn how to dissect data and understand this concept. [4:33]
Virtual Nerd
Virtual Nerd: What Is a Stem and Leaf Plot?
A Stem-and-Leaf plot is a type of graph in which data values are split into stems and leaves. This video will show you how to use these graphs, and show you how they can be used for practical purposes. [7:41]
Virtual Nerd
Virtual Nerd: How Do You Find the Mean of a Data Set?
Mean is another word for average. Learn how to determine the mean from a set of data. Watch this tutorial for an example. [3:13]
Virtual Nerd
Virtual Nerd: What Is the Mean of a Data Set?
Mean is the same thing as average when referring to a set of data. Watch this tutorial for an explanation and example. [4:05]
Virtual Nerd
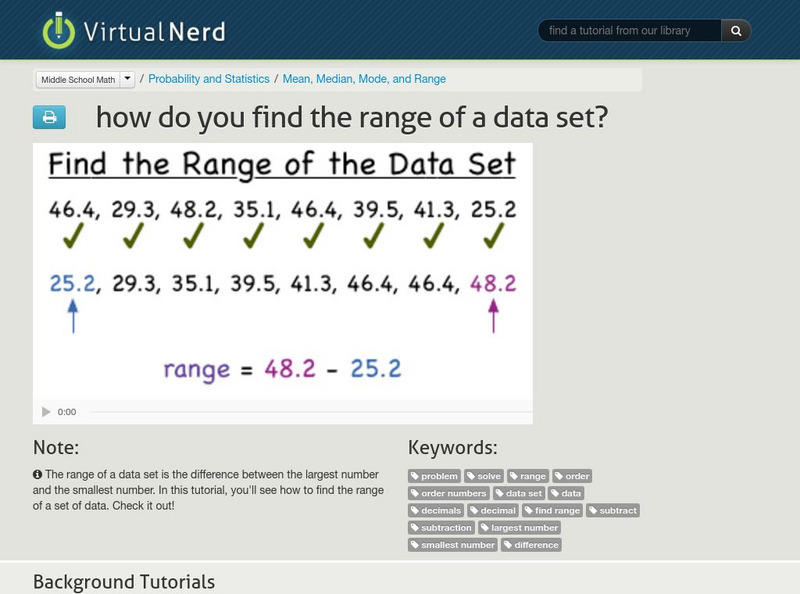
Virtual Nerd: How Do You Find the Range of a Data Set?
The range is the difference between the largest number and the smallest number in a set of data. View this video for an explanation and examples of finding the range. [3:16]
Virtual Nerd
Virtual Nerd: What Is the Mode of a Data Set?
Mode is a helpful measure of central tendency. Watch this video to see how to find mode with an explanation and examples. [4:36]
Virtual Nerd
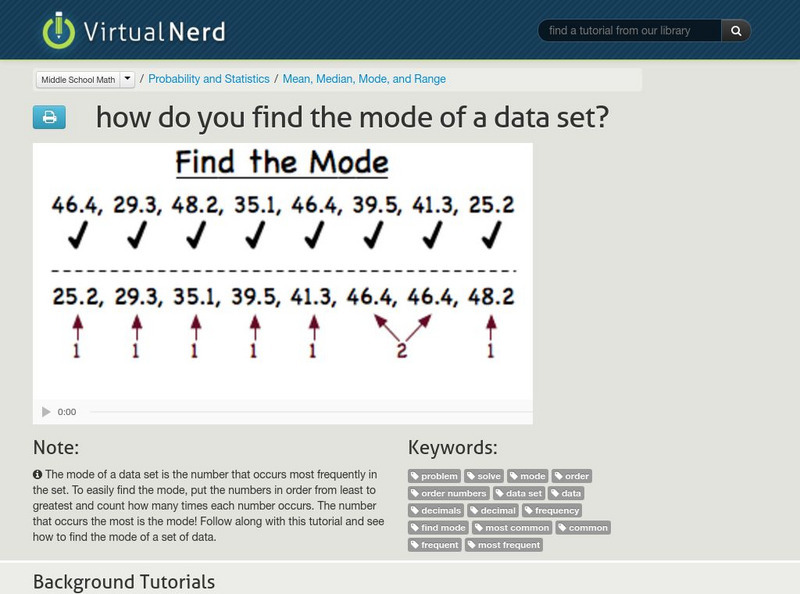
Virtual Nerd: How Do You Find the Mode of a Data Set?
The mode of a data set is the number that appears most frequently. Learn how to find the mode of a data set with these examples in this tutorial. [3:07]
Virtual Nerd
Virtual Nerd: How Do You Make a Histogram?
Make a histogram to show off data in a visual way. This video will walk you through the process and provide examples. [5:34]
Virtual Nerd
Virtual Nerd: What Is a Frequency Table?
Frequency tables tells you how often something occurs in a set of data. Watch this video for examples of frequency tables. [6:44]
Virtual Nerd
Virtual Nerd: What Is a Histogram?
How can you display numerical data in an easy to understand format? Watch this tutorial to find out how a histogram is helpful when analyzing and visualizing data. [5:23]
Virtual Nerd
Virtual Nerd: What Is a Line Plot?
A line plot is an effective way to visualize data. Watch this video for an explanation of line plots along with examples. [4:44]
Virtual Nerd
Virtual Nerd: How Do You Make a Frequency Table?
How can you visually show what occurs most often in a set of data? A frequency table is one way! Watch the step by step process on how to make a frequency table from a data set. [8:06]
Virtual Nerd
Virtual Nerd: How Do You Interpret a Circle Graph?
A circle graph can be an easy way to visualize data. Watch this video to learn more about circle graphs. [3:59]
Virtual Nerd
Virtual Nerd: What Is a Double Bar Graph?
A double bar graph is a good tool for visualizing a set of data. Watch this video for an explanation along with examples. [4:09]
Virtual Nerd
Virtual Nerd: How Do You Use a Line Graph to Make Predictions?
Can you use a line graph to make predictions? Watch and see how this can be done! [3:37]
Virtual Nerd
Virtual Nerd: How Do You Use a Circle Graph to Make Predictions?
Circle graphs can help predict the future. Watch and learn how this is possible! [4:57]


