Hi, what do you want to do?
Virtual Nerd
Virtual Nerd: What Is a Line Graph?
A line graph is one of many ways we can visually represent data. Watch this tutorial for examples. [4:05]
Virtual Nerd
Virtual Nerd: How Do You Interpret a Bar Graph With a Break in the Scale?
What happens when you have too much data to fit neatly on a bar graph? Watch this video to see an example of a set of data that is too big to fit all the intervals and how we interpret this type of graph. [4:29]
Virtual Nerd
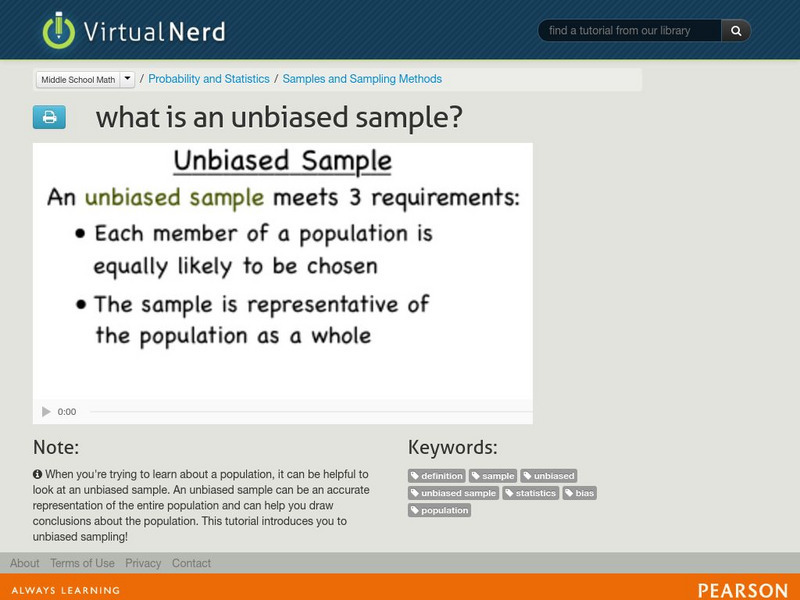
Virtual Nerd: What Is an Unbiased Sample?
When you are trying to learn a particular characteristic of a large population, you need to be able to study an unbiased sample of that population to be able to draw accurate conclusions. Watch this video for an in-depth explanation. [5:04]
Virtual Nerd
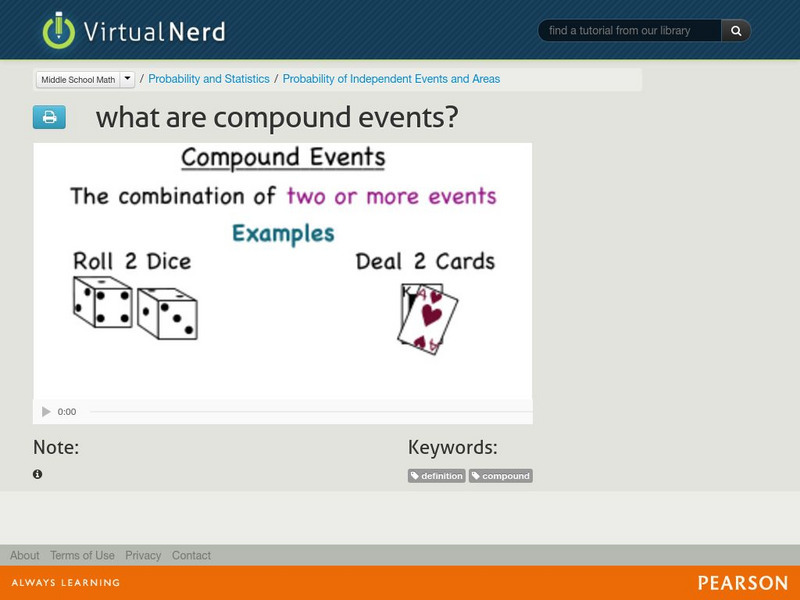
Virtual Nerd: What Are Compound Events?
What if we want to find the probability of more than one event occurring? This would be a compound event. Watch this video for an explanation and example. [3:29]
Virtual Nerd
Virtual Nerd: How Do You Use a Tree Diagram to Count the Number of Outcomes
Using a tree diagram is a helpful way to visualize all the possibilities from different options. Watch the step by step process of using a tree diagram. [6:16]
Virtual Nerd
Virtual Nerd: What Is a Permutation?
Permutations are arrangements of distinct objects where ORDER MATTERS. Watch the following video for and explanation and examples. [4:24]
Virtual Nerd
Virtual Nerd: How Do You Find a Number of Permutations Using Fcp?
The Fundamental Counting Principle can be used to find permutations. This tutorial will walk you through the steps with an example of finding the number of ways to rearrange the letters in the word NUMBER. [4:25]
Virtual Nerd
Virtual Nerd: How Do You Determine All the Possible Outcomes of an Experiment?
Watch how to make a list of all the possible outcomes of flipping a coin and rolling a dice. This video will walk you through the process using this experiment. [4:17]
Virtual Nerd
Virtual Nerd: How Do You Find the Probability of a Simple Event?
Probability is the likelihood that a given event will take place. So how do you determine the probability of a simple event? Watch this example using marbles for an explanation. [4:36]
Virtual Nerd
Virtual Nerd: How Do You Find the Probability of the Complement of an Event?
The complement of an event is the set of all non-favorable outcomes. Watch this demonstration to understand how to find the complement of an event. [5:36]
Virtual Nerd
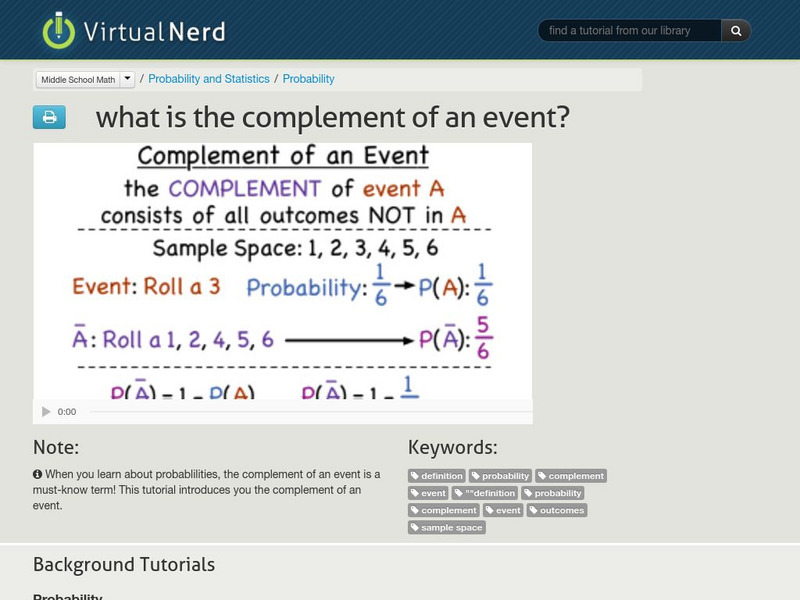
Virtual Nerd: What Is the Complement of an Event?
To understand complementary events, watch this video that explains the term along with examples. [4:53]
Virtual Nerd
Virtual Nerd: What Is an Outcome?
The outcome of an experiment is any possible result. Watch this tutorial for an explanation and an example using dice. [2:09]
Virtual Nerd
Virtual Nerd: What Is Probability?
In math, when you talk about the chance of an event occurring, you are talking about probability. Watch this tutorial for a full explanation. [5:17]
Virtual Nerd
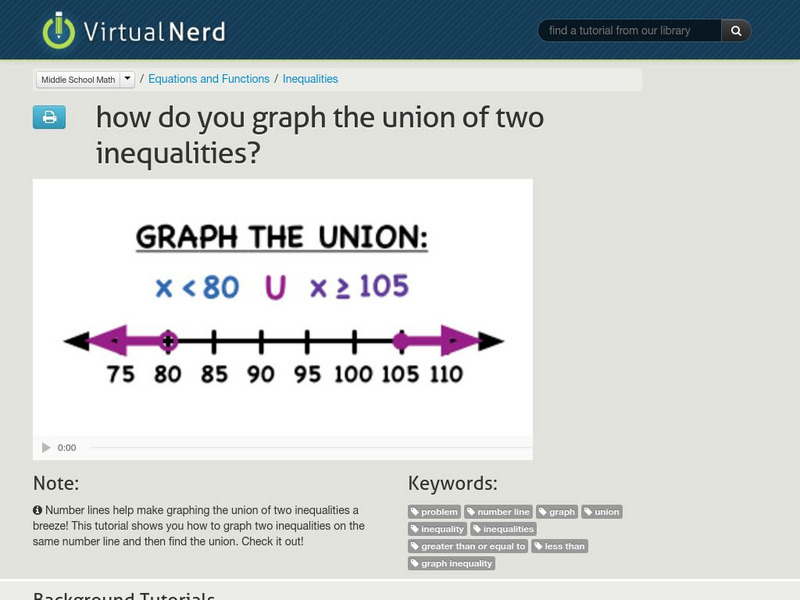
Virtual Nerd: How Do You Graph the Union of Two Inequalities?
This tutorial will teach you how to graph the union of two inequalities using a number line. [2:06]
Virtual Nerd
Virtual Nerd: What's a Compound Inequality?
Learn the definition of a compound inequality and how it can be written in set builder notation. This video provides an explanation and examples. [2:49]
Virtual Nerd
Virtual Nerd: What Are Some Words We Use to Write Inequalities?
Learn some of the common phrases associated with inequalities such as a compound inequality and an absolute power inequality. This tutorial will define these terms and provide examples. [4:22]
Virtual Nerd
Virtual Nerd: How Do You Graph the Intersection of Two Inequalities?
The intersection of two inequalities is what they have in common. This tutorial shows you how to graph two inequalities on the same number line and then find the intersection. [2:40]
Virtual Nerd
Virtual Nerd: How Do You Graph an Inequality or an Infinite Set on a Number Line
This tutorial will demonstrate how to graph an inequality and an infinite set on a number line. Closed and open circles are discussed using specific examples. [3:37]
Virtual Nerd
Virtual Nerd: How Do You Solve a One Step Inequality Using Subtraction?
Learn how to solve an inequality using the subtraction property. This video will demonstrate the process using a number line. [3:49]
Virtual Nerd
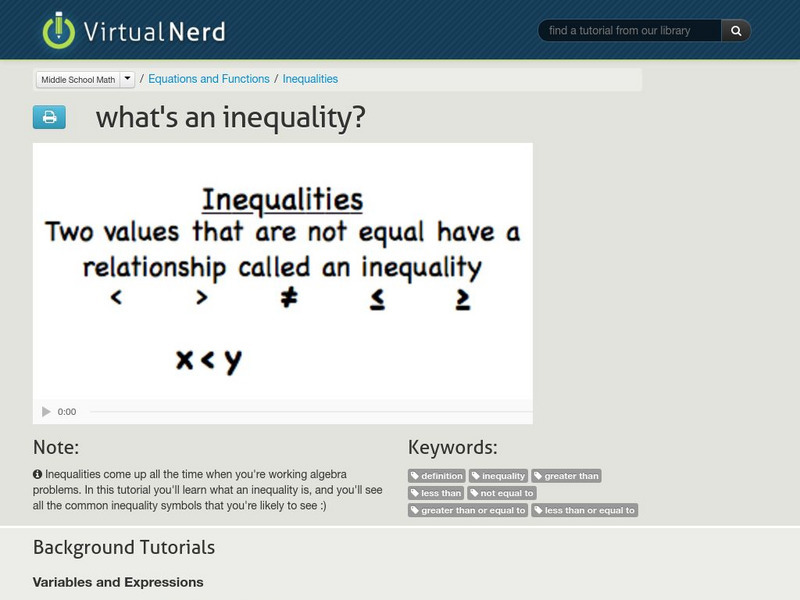
Virtual Nerd: What's an Inequality?
This tutorial answers the question "what's an inequality" by explaining the concept along with all the common inequality symbols that you may come across. [1:51]
Virtual Nerd
Virtual Nerd: How Do You Solve a Two Step Equation?
This tutorial demonstrates how to solve a multi-step equation for a variable. A step by step process is given with examples. [3:45]
Virtual Nerd
Virtual Nerd: What Does the Slope of a Line Mean?
In math, lines are used to show the rate that an amount is changing. The slope is the steepness of a line. How do we assign an actual number value to the steepness of a line? This tutorial will walk you through the process of finding...
Virtual Nerd
Virtual Nerd: What Is Rate of Change?
Rate of change explains how one quantity changes in relation to another quantity. The following tutorial gives an explanation and example of this concept including an explanation of positive and negative rates of change. [6:21]
Virtual Nerd
Virtual Nerd: How Do You Graph a Linear Equation by Making a Table?
To graph a function, you first need a table of values to fit your equation. This video will demonstrate how to make a table and then plot those values to make a graph. [3:23]


