Curated by
ACT
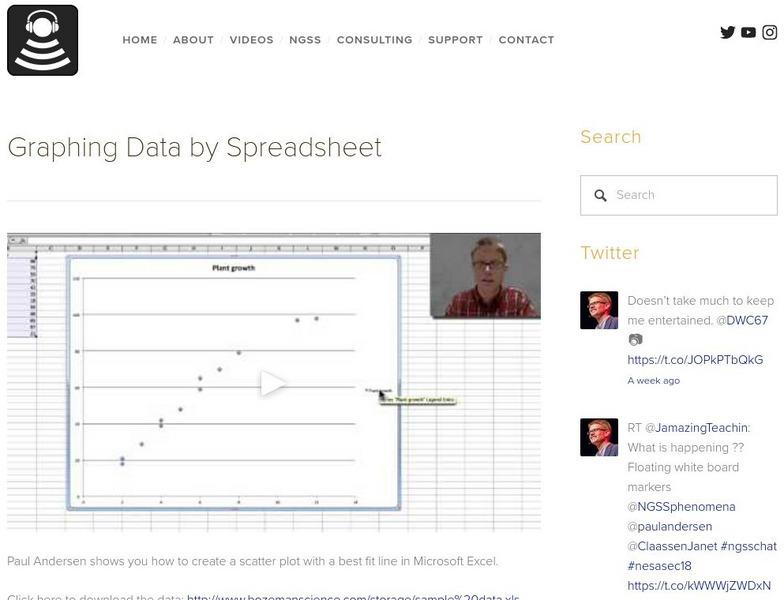
Paul Andersen shows you how to create a scatter plot with a best fit line in Microsoft Excel. You can go here to download the data: http://www.bozemanscience.com/storage/sample%20data.xls
3 Views
0 Downloads
Concepts
Additional Tags
Classroom Considerations
- Knovation Readability Score: 3 (1 low difficulty, 5 high difficulty)
- The intended use for this resource is Instructional
