Lesson Planet
Search educational resources
  • Sign In Try It Free
  • AI Teacher Tools
    • Discover Resources Search reviewed educational resources by keyword, subject, grade, type, and more
    • Curriculum Manager (My Content) Manage saved and uploaded resources and folders To Access the Curriculum Manager Sign In or Join Now
    • Browse Resource Directory Browse educational resources by subject and topic
    • Curriculum Calendar Explore curriculum resources by date
    • Lesson Planning Articles Timely and inspiring teaching ideas that you can apply in your classroom
    • Our Story
    • Frequently Asked Questions
    • Testimonials
    • Contact Us
  • Pricing
  • School Access
    • Your school or district can sign up for Lesson Planet — with no cost to teachers
      Learn More
  • Sign In
  • Try It Free

Hi, what do you want to do?

Create a lesson plan
Generate resources with 80+ AI teacher tools
Search 200,000 instructional videos
Find a teaching resource
Digital Scholarship Lab: Voting America: Elections 1840 2008 GraphicDigital Scholarship Lab: Voting America: Elections 1840 2008 Graphic
Publisher
University of Richmond
Resource Details
Curator Rating
Educator Rating
Not yet Rated
Grade
9th - 10th
Subjects
Social Studies & History
2 more...
Resource Type
Graphics & Images
Audiences
For Administrator Use
2 more...
Lexile Measures
1360L
Graphic

Digital Scholarship Lab: Voting America: Elections 1840 2008

Curated by ACT
This Digital Scholarship Lab: Voting America: Elections 1840 2008 graphic also includes:
  • Map
  • Join to access all included materials

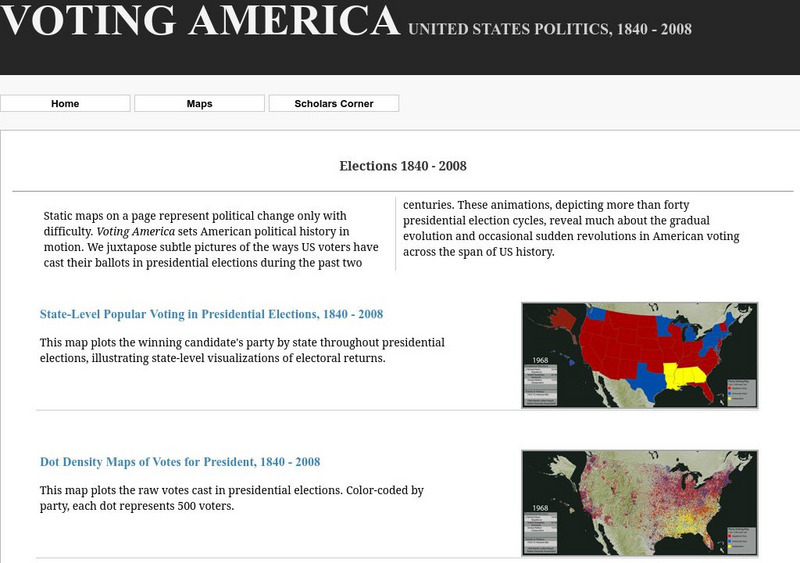
Resource juxtaposes subtle pictures of the ways US voters have cast their ballots in presidential elections during the past two centuries. These animations, depicting more than forty presidential election cycles, reveal much about the gradual evolution and occasional sudden revolutions in American voting across the span of US history.

3 Views 0 Downloads

Concepts

ballots, presidential elections, elections

Additional Tags

digital scholarship lab: voting america: elections 1840 - 2008

Classroom Considerations

  • Knovation Readability Score: 5 (1 low difficulty, 5 high difficulty)

See similar resources:

Graphic

Digital Scholarship Lab: Voting America: Presidential Elections 1840 1880

University of Richmond
Presented are various maps that show how American voters have cast their ballots in US presidential elections from 1840-1880.
9th - 10th Social Studies & History
Graphic

Digital Scholarship Lab: Voting America: Presidential Elections 1972 2008

University of Richmond
Presented are various maps that show how American voters have cast their ballots in US presidential elections from 1972-2008.
9th - 10th Social Studies & History
Graphic

Digital Scholarship Lab: Voting America: Congressional Elections

University of Richmond
Animated maps analyze data pertaining to congressional elections b.etween 1992-2008.
9th - 10th Social Studies & History
Graphic

Digital Scholarship Lab: Voting America: Presidential Elections 1928 1968

University of Richmond
Presented are various maps that show how American voters have cast their ballots in US presidential elections from 1928-1968.
9th - 10th Social Studies & History
Graphic

Digital Scholarship Lab: Voting America: Presidential Elections 1884 1924

University of Richmond
Presented are various maps that show how American voters have cast their ballots in US presidential elections from 1884-1924.
9th - 10th Social Studies & History
Interactive

Digital Scholarship Lab: Voting America: White Population Density, 1840 2000

University of Richmond
This map shows population change among whites in US counties, 1840 to 2000. Each dot represents 500 people. Corresponding historical events and elections are included for each period of time.
9th - 10th Social Studies & History
Interactive

Digital Scholarship Lab: American Panorama: Foreign Born Population

University of Richmond
Explore trends in immigration to the United States between 1850 and 2010 with this interactive map. Each year shows the numbers of people that were born in a foreign country, with the data being represented in multiple ways. Use the...
9th - 10th Social Studies & History
Interactive

Digital Scholarship Lab: American Panorama: Renewing Inequality

University of Richmond
For a quarter-century, the federal government provided funding for cities large and small to raze "blighted" or "slum" neighborhoods. Through these programs, cities displaced hundreds of thousands of families from their homes and...
9th - 10th Social Studies & History
Website

Digital Scholarship Lab: Redlining Richmond 1930s

University of Richmond
As part of the New Deal, the HOLC assessed neighborhoods using a number of factors in order to identify safe places for mortgages. The assessment surveys and map produced for Richmond, which this site allows you to explore in detail,...
9th - 10th Social Studies & History
Interactive

Digital Scholarship Lab: African American Population Density, 1840 2000

University of Richmond
This interactive map shows the African-American population change in U.S. counties from 1840 to 2000. Each dot represents 500 people. Corresponding historical events are included for each period of time.
9th - 10th Social Studies & History
Try It Free
© 1999-2026 Learning Explorer, Inc.
Teacher Lesson Plans, Worksheets and Resources

Sign up for the Lesson Planet Monthly Newsletter

Open Educational Resources (OER)

  • Health
  • Language Arts
  • Languages
  • Math
  • Physical Education
  • Science
  • Social Studies
  • Special Education
  • Visual and Performing Arts
View All Lesson Plans

Discover Resources

  • Our Review Process
  • How it Works
  • How to Search
  • Create a Collection

Manage Curriculum

  • Edit a Collection
  • Assign to Students
  • Manage My Content
Contact Us Site Map Privacy Policy Terms of Use