CK-12 Foundation
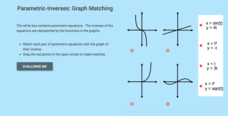
Parametric-Inverses: Graph Matching
Perform a switch to find the inverse of a parametric equation. Pupils match four parametric functions with the graph of the their inverses. Using the graphs, learners determine whether particular points are on the original parametric...
CK-12 Foundation
Inverse Functions: Definition of Inverse Functions
Is the inverse of a function also a function? Pupils manipulate the graph of a function to view its inverse to answer this question. Using a horizontal and vertical line, class members determine whether the initial function is...
CK-12 Foundation
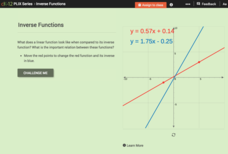
Inverse Functions
Provide a graphical view of inverses. Pupils manipulate points on a line and see the relationship of the graph with the graph of its inverse. Using the relationship between the graphs, scholars respond to questions concerning inverses...
CPALMS
Writing an Exponential Function from its Graph
Grow an equation for the exponential graph. Given a graph of an exponential function, class members write the equation of the function provided. The graph labels two points on the graph: the y-intercept and the point where x is one.
Desmos
Desmos Graphing Calculator
They say a graph is worth a thousand points. The interactive allows users to graph a wide variety of functions and equations. Using the included keyboard or typing directly into the list, learners determine the graph of a function....
CK-12 Foundation
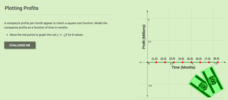
Graphs of Functions Based on Rules: Plotting Profits
Profit from this interactive on graphing and interpreting functions. An interactive allows learners to plot a square root function representing a company's profits. They answer some challenge questions that require interpreting this...
CK-12 Foundation
Graphs in the Coordinate Plane: Functions on a Cartesian Plane
Connect the dots to graph a linear function. Young mathematicians use an interactive to first plot provided points on a coordinate plane. They connect these points with a line and then answer questions about the slope and y-intercept of...
CK-12 Foundation
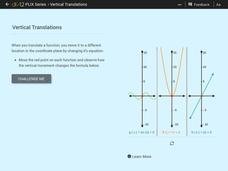
Vertical Translations
Change the y-intercept by adding a constant to the function. Individuals move three functions vertically along the y-axis. As they observe how the equation of the functions change with the vertical movement, learners determine how to...
CK-12 Foundation
Horizontal Translations or Phase Shifts: Cosine
If cosine is shifted, how is its equation affected? Learners manipulate the graph of cosine by moving the y-intercept to different locations on the coordinate plane. Pupils determine the new equation that models the shifts.
CK-12 Foundation
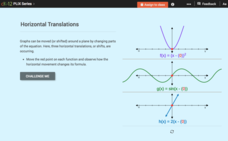
Horizontal Translations or Phase Shifts: Horizontal Translations
Find out what causes a function to slide. Pupils move a function along the x-axis and see the resulting change in its equation. Scholars determine the effects that the translation has on the intercepts, domain, and range of the function.
CK-12 Foundation
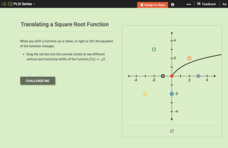
Vertical Translations: Translating a Square Root Function
How does the equation of a function reflect translations? Scholars manipulate the starting point of the parent square root function before determining the new equations that result from the translations. Class members also determine the...
CK-12 Foundation
Horizontal Translations or Phase Shifts: Horizontal and Vertical Translations
It is all about the shift. Pupils translate the graph of a cubic function to different marked locations on the plane and determine the new equation that represents the shifts. The activity is designed to encourage individuals begin to...
CK-12 Foundation
Horizontal Translations or Phase Shifts: Tangent
Patterns can be shifty! Find the pattern when shifting the graph of tangent. Pupils move the graph of tangent to different locations on the coordinate plane. They observe what happens to the function and its vertical asymptotes before...
CK-12 Foundation
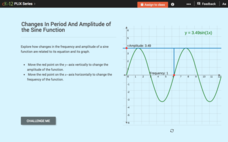
Changes in Period and Amplitude of the Sine Function
How does a change in amplitude or period affect the equation of a sine function? Scholars move sliders to change the frequency and period of the sine function. The interactive displays the resulting equation, and pupils determine the...
Mathematics Vision Project
Connecting Algebra and Geometry
Connect algebra and geometry on the coordinate plane. The eighth unit in a nine-part integrated course has pupils develop the distance formula from the Pythagorean Theorem. Scholars prove geometric theorems using coordinates including...
Mathematics Vision Project
Features of Functions
What are some basic features of functions? By looking at functions in graphs, tables, and equations, pupils compare them and find similarities and differences in general features. They use attributes such as intervals of...
PBL Pathways
Death Project
Verify the rule of thumb for finding the time of death. The project-based learning task asks pupils to determine when the rule of thumb process of finding the time of death is appropriate. Learners develop a function for the rule and...
Intel
Choreographing Math
Leaners investigate families of linear functions through dance. They choreograph dance moves to model nine unique linear functions of their choosing. Using their dance moves, teams create a video presentation complete with music and...
Virginia Department of Education
Functions 1
Scholars learn what it means for a relation to be a function and see various representations of functions. After learning the definition, they participate in a card sorting activity classifying relations as functions or not.
Virginia Department of Education
Transformational Graphing
Find relationships between the structure of a function and its graph. An engaging lesson explores seven parent functions and their graphs. Learners match functions to their graphs and describe transformations.
Point Pleasant Beach School District
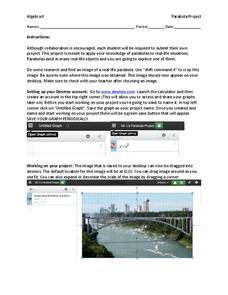
Parabola Project
Class members select a picture that contains a parabola and construct a drawing of it using function graphs in the quadratic project. Individuals restrict the domains of the functions to create a more accurate drawing. They then submit a...
Illustrative Mathematics
Latitude
The greater the latitude, the less of the Earth is north. Scholars graph the relationship between the latitude and the percentage of the Earth that is north of the latitude. Using the graph and the table, class members interpret values...
Illustrative Mathematics
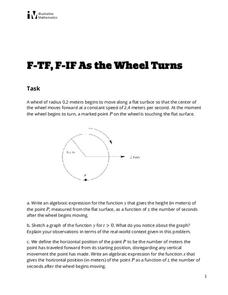
As the Wheel Turns
Determine the location of a point on a moving wheel. The task challenges groups to determine the horizontal and vertical locations of a point on the edge of wheel that is moving. Teams first determine a function that will model the...
Illustrative Mathematics
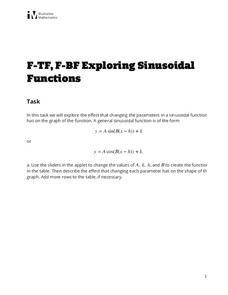
Exploring Sinusoidal Functions
What effect does changing a parameter have on the graph of a trigonometric function? Pupils use a Desmos applet to explore the general sine graph. They experiment changing different parameters and record the resulting change of the...


