EngageNY
Analyzing a Graph
Collaborative groups utilize their knowledge of parent functions and transformations to determine the equations associated with graphs. The graph is then related to the scenario it represents.
Curated OER
Real-World Linear Programming
Explore linear programming on a website game. Partners solve a real-world problem by setting up an objective function and a linear inequality. They graph their results on chart paper and also using a calculator before presenting their...
Inside Mathematics
Picking Apples
Getting the best pick of the apples depends on where to pick. The short assessment presents a situation in which class members must analyze a real-world situation to determine the cost of picking apples. The pricing structures resemble...
Curated OER
Functions and the Vertical Line Test
Students explore the concept of functions. In this function lesson, students determine if the graph is a function by using the vertical line test. Students use an applet to explore the vertical line test on a variety of graphs.
Balanced Assessment
Postcards from the Falls
Pupils use graphs to analyze two pricing schemes for postcards. After determining which is the best deal, individuals determine what is wrong with the other pricing structures and explain their thinking.
EngageNY
Two Graphing Stories
Can you graph your story? Keep your classes interested by challenging them to graph a scenario and interpret the meaning of an intersection. Be sure they paty attention to the detail of a graph, including intercepts, slope,...
Curated OER
Perfect Shuffles
Learners investigate piecewise functions. In this algebra instructional activity, students model piecewise functions in the real world. They graph the parts of the functions following the restrictions of the domain.
Concord Consortium
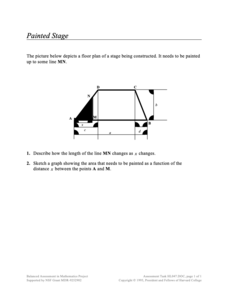
Painted Stage
Find the area as it slides. Pupils derive an equation to find the painted area of a section of a trapezoidal-shaped stage The section depends upon the sliding distance the edge of the painted section is from a vertex of the trapezoid....
CCSS Math Activities
Smarter Balanced Sample Items: High School Math – Claim 3
Communication is the key. A presentation provides 25 sample items for Claim 3, Communicating Reasoning, for the Smarter Balanced High School Math assessment. Items require pupils to answer the question and provide logical reasoning to...
Curated OER
Linear Graph
Students solve linear equations and graph the different functions. In this algebra lesson, students graph piecewise functions using the slope and y-intercept and the given restrictions on the domain of the line. They discuss rate of...
Curated OER
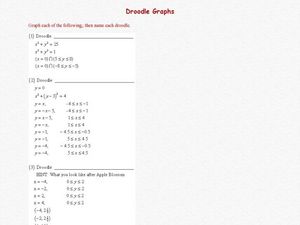
Droodle Graphs
In this algebra activity, students graph piecewise functions, and circles using restrictions. They graph a line and chop it on both ends to create a stair case looking graph or a ladder. There are 3 involve questions with an answer key.
Curated OER
Plotting Data Tables
Students make a table and plot their data on a graph. For this algebra lesson, students graph piecewise functions using the given equations along with the restricted domain. They calculate the rate of change.
Alabama Learning Exchange
I'm Lovin' It: Finding Area Between Curves
Students explore the concept of finding the area between two curves. In this finding the area between two curves instructional activity, students model the logos of McDonalds, Nike, and Motorola on grid paper. Students find functions to...
Alabama Learning Exchange
Technology for Displaying Trigonometric Graph Behavior: Sine and Cosine
Students explore the concept of sine and cosine. In this sine and cosine lesson, students work in groups to graph sine and cosine functions. Students examine how coefficients in various parts of each parent function shift the graph. ...
Curated OER
Solar Flare Reconstruction
For this solar flare reconstruction worksheet, students read about the 'saturation' point of satellite detectors when solar flares are at their most intense phase of brightness. Students are given x-ray flare data and they re-plot the...
Intel
Pedal Power
Show your classes the importance of mathematics in something as simple as bicycle design. The final lesson in the six-part STEM series has each group research a different aspect of the bicycle. Learners use mathematical formulas, linear...
Curated OER
Let's Get Physical
Students collect data using the CBL. In this statistics activity, students predict the type of graph that will be created based on the type of activity the person does. The graph represents heart rate depending the level of activity.
Alabama Learning Exchange
There's Gold in Them There Hills
Need to build a laser fence on Mars? In this cute maximizing-area lesson plan, young explorers pretend to be prospectors on Mars and must determine the best way to use 20 meters of fencing in order to maximize their area. In addition,...
Alabama Learning Exchange
Bloodstain Pattern Doesn't Lie......
An interesting instructional activity on hypothesizing about the diameter of a drop of blood that is splattered. To test their theories, learners work in groups to make blood droplets splatter from different heights. They use graphed...
Curated OER
NEXT GENERATION SPACECRAFT-Orion
Students investigate the volume of a solid. In this calculus lesson, students use integration to find the volume of a solid generated by a region, the Orion crew module.
Curated OER
Absolute Value Equations and Inequalities
Students explore the concept of absolute value inequalities and equations. In this absolute value inequalities and equations lesson, students discuss how to solve absolute value inequalities and equations through teacher led discussion...


