Curated OER
Literary Analysis: Summary vs. Analysis
What is the difference between summary writing and literary analysis? A 16-slide presentation offers some basic requirements for both types of writing and helps readers identify each based on keywords used in both types of writing....
Curated OER
Using Matrices to Enter Data and Perform Operations
Here's a TI step by step guided lesson on matrices. The class enters data into the TI calculator about movie ticket sales and uses matrices as a problem solving tool. They add and multiply matrices to determine profit.
Curated OER
Human Population- Changes in Survival Rates Data Interpretation
In this human population changes in survival worksheet, students interpret and plot data to understand the differences in human mortality and survivorship between historic and modern times. They investigate how these changes influence...
Curated OER
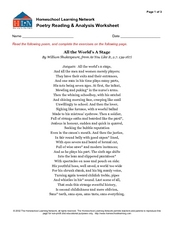
Poetry Reading and Analysis Worksheet - As You Like It
Enhance your lesson on Shakespeare with this poetry activity. After reading lines 139-167 from As You Like It Act II, Scene 7 (provided on the first page), middle schoolers work on a graphic organizer to paraphrase each part of the poem....
Curated OER
WS 1.6 Dimensional Analysis
In this conversions instructional activity, learners use dimensional analysis to convert from one metric unit to another and from the English system of measurement to the metric system.
Curated OER
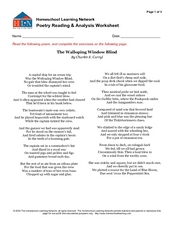
Poetry Reading: Analysis Worksheet
Explore poetry by reading the poem "The Walloping Window Blind" by Charles E. Carryl, and completing an analysis with your class. The worksheet provides the entire poem, a graphic organizer to help with summarizing and paraphrasing, and...
Curated OER
Data Strategies that Drive Motivation
Sharing data after mastery checks or summative assessments helps your learners plot their growth and increases investment.
CK-12 Foundation
Types of Data Representation: Baby Due Date Histogram
Histograms are likely to give birth to a variety of conclusions. Given the likelihood a woman is to give birth after a certain number of weeks, pupils create a histogram. The scholars use the histogram to analyze the data and answer...
Curated OER
Lyric Analysis: Reflection
The Woody Guthrie song,"I Ain’t Got No Home in This World Anymore" invites upper graders to engage in lyric analysis. They use the lyrics to answer five analysis questions to determine a social meaning to the song. A suggested answer...
Curated OER
WS 2.5 Dimensional Analysis
Science high schoolers apply dimensional analysis to relate quantities in six different problems. They consider the cost of steak, a young man's growth rate, a medicine prescription, fuel efficiency, and more. This activity is a great...
Code.org
Making Data Visualizations
Relax ... now visualize the data. Introduce pupils to creating charts from a single data set. Using chart tools included in spreadsheet programs class members create data visualizations that display data. The activity encourages...
Code.org
Practice PT - Tell a Data Story
Show your class how it all comes together. The last lesson in a unit of 15 has individuals take everything they learned in the data section to analyze the class-generated data. The pupils find a story they want to tell that appeals to...
EngageNY
Summarizing a Data Distribution by Describing Center, Variability, and Shape
Put those numbers to work by completing a statistical study! Pupils finish the last two steps in a statistical study by summarizing data with displays and numerical summaries. Individuals use the summaries to answer the statistical...
Mathematics Vision Project
Module 9: Modeling Data
How many different ways can you model data? Scholars learn several in the final module in a series of nine. Learners model data with dot plots, box plots, histograms, and scatter plots. They also analyze the data based on the data...
Fort Bend Independent School District
Data Analysis - AP Statistics
What better way to study survey design than to design your own survey! Bring a versatile data analysis project to your AP Statistics class, and encourage them to apply the practices from their instructions to a real-world survey project.
NOAA
Ground-truthing Satellite Imagery with Drifting Buoy Data
Ground-truthing ... is it even a word? The last installment of a five-part series analyzes how scientists collect sea surface temperature data. Scholars use government websites to compare temperature data collected directly from buoys...
Chicago Botanic Garden
Plant Phenology Data Analysis
Beginning in 1851, Thoreau recorded the dates of the first spring blooms in Concord, and this data is helping scientists analyze climate change! The culminating instructional activity in the series of four has pupils graph and analyze...
Chicago Botanic Garden
Plant Phenology Data Analysis
Scientists monitor seasonal changes in plants to better understand their responses to climate change, in turn allowing them to make predictions regarding the future. The last activity in the series of six has scholars analyze BudBurst...
EngageNY
Variability in a Data Distribution
Scholars investigate the spread of associated data sets by comparing the data sets to determine which has a greater variability. Individuals then interpret the mean as the typical value based upon the variability.
EngageNY
Comparing Data Distributions
Box in the similarities and differences. The 19th lesson in a unit of 22 presents class members with multiple box plots to compare. Learners use their understanding of five-number summaries and box plots to find similarities and...
Statistics Education Web
First Day Statistics Activity—Grouping Qualitative Data
Making groups of groups can help to organize data. Classes use statistics to group themselves using descriptive adjectives. The objective is for learners to understand that grouping qualitative data is useful when the original groups are...
EngageNY
Qualities of a Strong Literary Analysis Essay
Read like a writer. Scholars read a model literary analysis in preparation for a similar writing assignment before annotating each paragraph for the gist. Next, pupils devise a list of qualities of a strong literary analysis essay.
EngageNY
Analyzing a Data Set
Through discussions and journaling, classmates determine methods to associate types of functions with data presented in a table. Small groups then work with examples and exercises to refine their methods and find functions that work to...
EngageNY
Summarizing Bivariate Categorical Data with Relative Frequencies
It is hard to determine whether there is a relationship with the categorical data, because the numbers are so different. Working with a familiar two-way table on super powers, the class determines relative frequencies for each cell and...
Other popular searches
- Data Analysis
- Literary Analysis
- Character Analysis
- Poetry Analysis
- Data
- Data, Census, & Statistics
- Character Sketch
- Word Analysis
- Analyzing Poetry
- Thinking Analysis
- Dimensional Analysis
- Analysis Song Lyrics


