Curated OER
Inside OKCupid: The Math of Online Dating
Capture the hearts of your young statisticians with this real-life example of using statistics in online dating. The use of average and geometric mean are discussed in the context of creating the algorithm used to connect people.
Statistics Education Web
The Case of the Careless Zookeeper
Herbivores and carnivores just don't get along. Using a box of animal crackers, classes collect data about the injury status of herbivores and carnivores in the box. They complete the process of chi-square testing on the data from...
Concord Consortium
Gestation and Longevity
Is the gestation length of an animal a predictor of the average life expectancy of that animal? Learners analyze similar data for more than 50 different animals. They choose a data display and draw conclusions from their graphs.
Curated OER
Classification/Taxonomy/Statistics Review
"Does King Phillip Cry Over Flimsy Grass Stems?" You might not answer that question with this exhaustive instructional activity, but your biology class will get the full scoop on the hierarchy of biological classification with this...
Curated OER
Animal Issues: Let's Talk Turkey
Thanksgiving means an untimely demise for thousands of turkeys every year. This turkey Q and A provides nine questions bringing facts and statistics of turkey consumption to the discussion table. There is an answer key that provides full...
Curated OER
The Coyote Population: Kansas Prairies
Students discover animal lifestyles by researching their ecosystem. In this animal statistics lesson, students research the geography of Kansas and discuss the reasons why wild animals survive in the open Kansas fields. Students complete...
Curated OER
All About Graphs
Students practice organizing data by creating graphs. In this statistics instructional activity, students survey the class about favorite colors and create a bar graph using the data. Students complete a test based on pet and animal...
Curated OER
Who's Range is it?
Students investigate the habits of panthers by analyzing radio transmitted data. In this animal life lesson, students utilize computers to view the range of different statistics dealing with Florida panthers. Students complete a...
Curated OER
Graphing Statistics & Opinions About Pets
Students explore how to use a double bar graph by polling other students about their feelings and experiences with pets. They also have the opportunity to think about how pets affect their lives. Students poll their classmates to find...
Curated OER
Are you an Animal Sleuth?
Students define and identify both wild and domestic animals as well as mammals and non-mammals. In this animal safety activity, students distinguish between animals that can carry rabies from those that cannot. Students use stuffed...
Curated OER
Do You Feel Lucky?
Students explore probability by using games based on probable outcomes of events. They name all of the possible outcomes of an event and express the likelihood of such an event occurring.
Shodor Education Foundation
Rabbits and Wolves
A change in a parameter can end in overpopulation. The resources gives pupils the opportunity to control the parameters of rabbits and wolves in a natural setting. Using the set parameters, the simulation runs and displays the population...
Curated OER
Mapping Animal Behavior
Students discuss the value of sampling in science. They, in groups, map cricket movement in response to various stimuli and graph their results.
Curated OER
Analysis of Grooming Behavior in Drosophila melanogaster
Students engage in a lab that focuses on animal behavior in an open ended inquiry based laboratory experience. They build an ethogram, display a transition matrix and analyze a Markov Chain. They remove wings from the drosophila and...
Curated OER
Pet Overpopulation
Students examine pet overpopulation. In this animal welfare lesson, students discuss the causes and effects of pet overpopulation. Students color in an animal page and identify the responsibilities of owning a pet.
Curated OER
Form an Opinion-Cats
Students discuss which animal makes a better pet. In this statistics lesson, students examine the factors that cause people to choose one animal over the other (cat or dog). Students discuss their own opinions, and then view a video...
CK-12 Foundation
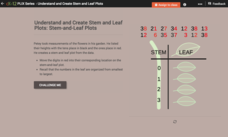
Understand and Create Stem-and-Leaf Plots: Stem-and-Leaf Plots
Explore the advantages to using a stem-and-leaf plot using an online lesson. Learners manipulate an animation to create a stem-and-leaf plot. They then calculate statistics for the data using their display. Guiding questions help them...
CK-12 Foundation
Multiple Line Graphs: Jack's Jumpshot
What are the advantages to seeing multiple data sets on the same graph? Scholars explore this question as they manipulate the animation within the lesson. Questions within the interactive ask individuals to make comparisons across the...
CK-12 Foundation
Mean: Arithmetic Mean
How is a mean affected by changes in data? A well-designed animation allows individuals to manipulate data and watch the effect on the mean. Challenge questions help guide users to conclusions about outliers and skew within data.
Curated OER
How Many Bears in the Forest?
Third graders model the tag and recapture of bears and use proportions to estimate the population of the bears in their forest. This is a statistical sampling method used by scientists and naturalists to determine population numbers.
Curated OER
Global Warming Statistics
Students research real-time and historic temperature data of U.S. and world locations, and analyze the data using mean, median, and mode averages. They graph the data and draw conclusions by analyzing the data. A spreadsheet is used to...
Curated OER
Functions and Statistics: International Space Station: Up to Us
Students explore how the International Space Station was built and how it provides first-hand experiences with the space program. They view the NASA engineers discussing the major components of the International Space Station, their...
Curated OER
Fun Faces of Wisconsin Agriculture: Curley's Beef Fast Facts
Students explore animal slaughter by researching the Wisconsin beef industry. In this meat statistics lesson, students practice using different math functions to identify how many burgers or sports equipment can be made from one...


