NASA
Data Literacy Cube: Global Atmospheric Temperature Anomaly Data
Evaluate global temperature anomalies using real-world data from NASA! Climatologists analyze a data set using a literacy cube and differentiated question sheets. Team members evaluate global temperature anomaly data with basic...
National Wildlife Federation
The Tide is High, but I’m Holding On… Using ICESat Data to Investigate Sea Level Rise
Based on the rate of melting observed from 2003-2007 in Greenland, it would take less than 10 minutes to fill the Dallas Cowboys' Stadium. The 17th lesson in a series of 21 has scholars use the ICESat data to understand the ice mass...
NOAA
Ground-truthing Satellite Imagery with Drifting Buoy Data
Ground-truthing ... is it even a word? The last installment of a five-part series analyzes how scientists collect sea surface temperature data. Scholars use government websites to compare temperature data collected directly from buoys...
Curated OER
Deep Convective Clouds
Young scholars observe clouds. In this deep convective clouds lesson, students analyze cloud data recorded over one month and draw conclusions based on results. Young scholars predict "Thunderstorm Season" and prepare to defend their...
Curated OER
Aerosol Lesson: Science - Graphing SAGE II Data
Learners examine and plot atmospheric data on bar graphs.
Curated OER
Sending Messages to Space
Students interpret a message sent to space using a radio telescope and draw inferences from the interpreted message. Working with a partner, they interpret data that scientists believe is a message from aliens. They work on organizing...
Columbus City Schools
What is Up Th-air? — Atmosphere
Air, air, everywhere, but what's in it, and what makes Earth's air so unique and special? Journey through the layers above us to uncover our atmosphere's composition and how it works to make life possible below. Pupils conduct research...
Curated OER
Creating Climographs
Students use satellite data to compare precipitation and surface temperatures on different islands. In this satellite lesson students create graphs and explain the differences between weather and climate.
Curated OER
Cold, Clouds, and Snowflakes
Students explore satellite data and graphing. In this weather data analysis math and science lesson, students analyze NASA satellite data to draw conclusions about geographical areas where precipitation might have happened. Students...
Science Geek
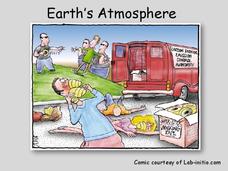
Earth's Atmosphere
Ozone gas absorbs the harmful UV-B rays and helps protect humans. An informative presentation begins with the layers of the earth's atmosphere, the pressure and temperature in each of the layers, the ozone layer, the ozone cycle, and the...
Council for Economic Education
Economic Data Lesson: Economic Policy Options
Can you make decisions that will impact millions of people around the nation? Scholars research the role of the Federal Reserve, and its Chairman, on the economic outlook of the country. They analyze current trends in unemployment,...
Chicago Botanic Garden
Historical Climate Cycles
What better way to make predictions about future weather and climate patterns than with actual climate data from the past? Young climatologists analyze data from 400,000 to 10,000 years ago to determine if climate has changed over time....
Howard Hughes Medical Institute
EarthViewer
Can you imagine Washington DC and London as close neighbors occupying the same continent? Learners will be fascinated as they step back in time and discover the evolution of the earth's continents and oceans from 4.5 billion years ago to...
Curated OER
Temperature and the Earth's Atmosphere
Earth science super stars visit the National Earth Science Teachers Association's interactive website to glean information on the layers of the atmosphere. Data tables are provided for them to record what is collected. This assignment...
Curated OER
Identifying Ozone Variations over Different Locations
Learners analyze ozone data. In this atmosphere lesson, students will use a NASA resource to gather data for different regions of the Earth. Learners will then create a graph for their data and answer related questions.
Laboratory for Atmospheric and Space Physics
Explore Saturn and Titan with Spectral Data
Titan is Saturn's largest moon and has its own atmosphere. An attention-grabbing tutorial allows learners to analyze the spectrum of Saturn and Titan to determine their elemental compositions. Scholars compare a known element's spectrum...
National Wildlife Federation
When It Rains It Pours More Drought and More Heavy Rainfall
Which is worse — drought or flooding? Neither is helpful to the environment, and both are increasing due to climate change. The 16th lesson in a series of 21 covers the average precipitation trends for two different climates within the...
National Wildlife Federation
Wherefore Art Thou, Albedo?
In the sixth lesson in a series of 21, scholars use NASA data to graph and interpret albedo seasonally and over the course of multiple years. This allows learners to compare albedo trends to changes in sea ice with connections to the...
Curated OER
Weather, Data, Graphs and Maps
Students collect data on the weather, graph and analyze it. In this algebra lesson, students interpret maps and are able to better plan their days based on the weather reading. They make predictions based on the type of clouds they see.
Curated OER
A Comparison Study of Water Vapor Data to Precipitation over North America
Students use NASA satellite data to compare water vapor over the United States. In this data analysis instructional activity students use an Excel spreadsheet to map their data.
US Department of Energy
Thermal Expansion of Water: Rise of Sea Level
Using bunsen burners, Erlenmeyer flasks, thermometers, hollow glass tubes, stoppers, and rulers, learners experiment with and measure how water expands when heated. The activity connects the expansion of water when heated to global...
Curated OER
Explore Surface Types on a Journey Around Earth
Young scholars explore satellite data. In this technology cross-curriculum math and world geography lesson, students locate specific map areas using a microset of satellite data. Young scholars use technology and math skills to determine...
Curated OER
How Does the Earth's Energy Budget Relate to Polar Ice?
Students use satellite data to see how radiation budget relates to the ice that is present in the North. In this energy lesson students correlate data to see a relationship.
Curated OER
Communicating Data
In this data instructional activity, students match information with the best type of graph to display it. Students also make a chart and graph to display information in a given paragraph.


