NOAA
Climate, Weather…What’s the Difference?: Make an Electronic Temperature Sensor
What's the best way to record temperature over a long period of time? Scholars learn about collection of weather and temperature data by building thermistors in the fourth installment of the 10-part Discover Your Changing World series....
Space Awareness
The Climate in Numbers and Graphs
Weather versus climate: weather relates to short time periods while climate averages the weather of a period of many years. Scholars learn about average temperature and precipitation in various climate zones and then apply statistics...
Curated OER
NIGHT AND DAY: DAILY CYCLES IN SOLAR RADIATION
Students examine how Earth's rotation causes daily cycles in solar energy using a microset of satellite data to investigate the Earth's daily radiation budget and locating map locations using latitude and longitude coordinates.
National Wildlife Federation
Why All The Wiggling on the Way Up?
Some of the CO2 emitted by burning fossil fuels is removed from the atmosphere by natural sinks, such as the ocean. The fifth engaging lesson plan in the series of 21 examines the CO2 data from three very different locations. It then...
National Wildlife Federation
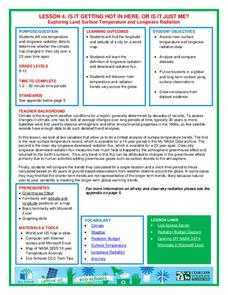
Is It Getting Hot in Here, or Is It Just Me?
Currently, only 2.1% of global warming is felt on continents, while over 93% is felt in the oceans. The fourth lesson in the series of 21 on global warming is composed of three activities that build off one another. In the first...
Chicago Botanic Garden
Micro-GEEBITT Climate Activity
A truly hands-on and inquiry based learning activity bridges all the lessons in the series together. Beginning with a discussion on average global temperatures, young meteorologists use real-world data to analyze climate trends in order...
National Wildlife Federation
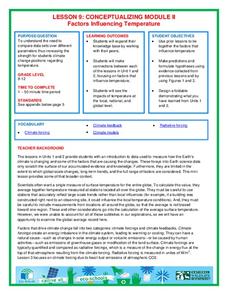
Conceptualizing Module II - Putting It All Together
"Creativity is just connecting things." - Steve Jobs. After weeks of researching climate change, the ninth lesson in a series of 21 combines the data and analysis to address essential questions. It covers natural phenomenon, human...
National Wildlife Federation
Quantifying Land Changes Over Time Using Landsat
"Humans have become a geologic agent comparable to erosion and [volcanic] eruptions ..." Paul J. Crutzen, a Nobel Prize-winning atmospheric chemist. Using Landsat imagery, scholars create a grid showing land use type, such as urban,...
Curated OER
Seasons and Cloud Cover, Are They Related?
Students use NASA satellite data to correlate cloud cover over Africa to the solar declination.
Curated OER
Watch the Sky: Observing Clouds and Patterns
Students observe clouds outside of the classroom. In this weather lesson, students investigate and record the clouds above their classroom everyday for three weeks. The students then analyze their data and discuss what causes specific...
Curated OER
The Greenhouse Effect
Why does it get so hot inside of our cars in the summertime? The greenhouse effect! Lab groups experiment to see what happens to an ice cube enclosed in a jar and placed in sunlight as compared to an ice cube outside of the jar. They...
NOAA
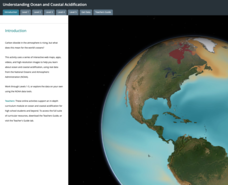
Ocean Acidification
Carbon dioxide is on the rise; does that also mean a rise in danger to humans and animals? Scholars learn what that means for the environment and more specifically the ocean. They examine data on the pH of different ocean areas and learn...
Curated OER
Atmosphere
This is a very basic presentation of the layers of the atmosphere. It divides the atmosphere into four layers and pretty much only mentions the elevation and order of each. The last of seven slides shows a pie graph and data table of the...
Curated OER
Hands-On Weather Data Collecting
Fifth graders use Internet sites to complete a study of weather and atmosphere. They compare weather data from cities around the world. They use thermometers, the Beaufort wind scale, and simple weather symbols to measure weather around...
US Environmental Protection Agency
Carbon Through the Seasons
Meteorologists view an animated video by the Environmental Protection Agency to learn how the carbon cycle works, and then move into groups to analyze and graph actual data of the atmospheric carbon dioxide concentration from Hawaii's...
Curated OER
Water in the Atmosphere
A slide show serves as the backdrop for a lesson on the moisture in Earth's atmosphere. Through it, mini meteorologists learn about the attributes of the atmosphere and actually use data-collecting weather tools to make observations and...
It's About Time
How Do Carbon Dioxide Concentrations in the Atmosphere Affect Global Climate?
Does carbon dioxide really affect temperatures across the world? This fifth installment in a six-part series investigates the relationship between carbon dioxide and global temperatures. Graphs created from genuine data help young...
Curated OER
Good Vibrations Remote Sensing data Collection: Thermal Emission Spectrometer
The Mars Global Surveyor spent two years creating a mineral map of the planet Mars using thermal emission spectrometry. To help young astronomers understand this remote sensing instrument, have them simulate how data is collected and...
NOAA
Climographs
In the second lesson of a five-part series, young climatologists use provided temperature and precipitation data to create climographs of three different cities. They then analyze these climographs to develop a general understanding of...
NOAA
How Do We Know?: Make Additional Weather Sensors; Set Up a Home Weather Station
Viewers learn about three different weather measurement tools in installment five of the 10-part Discover Your Changing World series. They build weather vanes to collect data on wind speed, barometers to determine air pressure, and rain...
Florida International University
Counting FishStix
How do we count the fish in the ocean? An engaging lesson models how to estimate fish populations with observational surveys. Class members begin by studying the behavior of fish on the coral reef in the oceans. They then become the fish...
Teach Engineering
Air Pressure
Investigate what is pushing on us. An intriguing lesson has pupils calculate the amount of force on various squares due to air pressure. Using the data, individuals create a graph in the third lesson of the Up, Up and Away unit...
Curated OER
Greenhouse Gases
Although the worksheet for the lab activity is not included, this is an activating activity for your class to do when learning about the greenhouse effect. They lay three thermometers underneath a lamp: one out in the open, one under a...
Curated OER
Analyzing Meteorological Data From Mars
Students compare real-time Earth and Mars measurements for temperature, wind speed, humidity and atmospheric pressure by accessing Internet-data resources from NASA. They access real-time weather data and maps for their school location.


