West Contra Costa Unified School District
Using Derivatives to Graph Polynomials
You can learn to graph as well as a calculator using calculus. The lesson introduces using derivatives to find critical points needed to graph polynomials. Pupils learn to find local maximums and minimums and intervals of increase and...
National Wildlife Federation
The Tide is High, but I’m Holding On… Using ICESat Data to Investigate Sea Level Rise
Based on the rate of melting observed from 2003-2007 in Greenland, it would take less than 10 minutes to fill the Dallas Cowboys' Stadium. The 17th lesson in a series of 21 has scholars use the ICESat data to understand the ice mass...
National Sailing Hall of Fame
Sail Area Calculations
Do bigger sails mean that the sailboat goes faster? Middle and high schoolers compare sailboats, and learn that simply calculating sail area is not enough. A slideshow presentation demonstrates how to calculate the Sail Area to...
EngageNY
Using Sample Data to Compare the Means of Two or More Populations II
The 23rd segment in a series of 25 presents random samples from two populations to determine whether there is a difference. Groups determine whether they believe there is a difference between the two populations and later use an...
National Math + Science Initative
Using Linear Equations to Define Geometric Solids
Making the transition from two-dimensional shapes to three-dimensional solids can be difficult for many geometry learners. This comprehensive Common Core lesson plan starts with writing and graphing linear equations to define a bounded...
Federal Reserve Bank
Market Basket SMART/ActivInspire Lesson Plan
Inflate your knowledge, not the economy! Pupils learn more about inflation with detailed worksheets and exciting activities such as role play, an interactive PowerPoint presentation, and a project in which they design a podcast on...
Curated OER
Calculating Sales Tax
Observe and demonstrate how to calculate state sales taxes. Learners create a sales tax chart by calculating the sales tax amount and tax inclusive retail price for school store items, then calculate the subtotals, sales tax amounts, and...
EngageNY
Calculating Conditional Probabilities and Evaluating Independence Using Two-Way Tables (part 1)
Being a statistician means never having to say you're certain! Learners develop two-way frequency tables and calculate conditional and independent probabilities. They understand probability as a method of making a prediction.
EngageNY
Calculating Conditional Probabilities and Evaluating Independence Using Two-Way Tables (part 2)
Without data, all you are is another person with an opinion. Show learners the power of statistics and probability in making conclusions and predictions. Using two-way frequency tables, learners determine independence by analyzing...
EngageNY
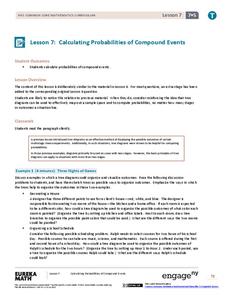
Calculating Probabilities of Compound Events
Use tree diagrams with multiple branches to calculate the probabilities of compound events. Pupils use tree diagrams to find the sample space for probability problems and use them to determine the probability of compound events in the...
EngageNY
Solving Area Problems Using Scale Drawings
Calculate the areas of scale drawings until a more efficient method emerges. Pupils find the relationship between the scale factor of a scale drawing and the scale of the areas. They determine the scale of the areas is the square of the...
EngageNY
Using a Curve to Model a Data Distribution
Show scholars the importance of recognizing a normal curve within a set of data. Learners analyze normal curves and calculate mean and standard deviation.
EngageNY
Using Permutations and Combinations to Compute Probabilities
Now that we know about permutations and combinations, we can finally solve probability problems. The fourth installment of a 21-part module has future mathematicians analyzing word problems to determine whether permutations or...
EngageNY
Making Scale Drawings Using the Ratio Method
Is that drawn to scale? Capture the artistry of geometry using the ratio method to create dilations. Mathematicians use a center and ratio to create a scaled drawing. They then use a ruler and protractor to verify measurements.
EngageNY
Incredibly Useful Ratios
Start the exploration of trigonometry off right! Pupils build on their understanding of similarity in this lesson plan that introduces the three trigonometric ratios. They first learn to identify opposite and adjacent...
Curated OER
Using a Calculator
Students use a calculator to solve math problems. In this calculator usage lesson, students get into pairs and familiarize themselves with the keys. Students are then given problems to solve using the calculator. Students do Smart Board...
Bonneville
How Much Energy Do YOU Use?
Determine the power hog in the house. Pupils learn the difference between power and energy before participating in a hands-on activity. Using a power meter, pairs measure the actual power used for several household devices, estimate the...
Chicago Botanic Garden
Calculating Your Ecological Footprint
You can lower your ecological footprint by recycling! Lesson four in this series of five has individuals, through the use of a computer, calculate their ecological footprints. Through discussions and analysis they determine how many...
Science Geek
Calculations of Solution Concentration
Teach the process of calculating concentrations of a solute. The fourth in a series of seven chemistry lessons shows the various types of calculations including grams per liter, molarity, parts per million, and percent composition. The...
Learning Games Lab
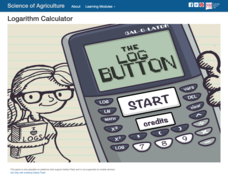
Logarithm Calculator
Support your young scientists' knowledge of logarithms with a quick video lesson. The instruction first presents the relationship between a base-10 logarithm and an exponential equation. It then demonstrates how to use a calculator to...
Buffalo State
A Five Day Approach to Using Technology and Manipulatives to Explore Area and Perimeter
Young mathematicians build an understanding of area and perimeter with their own two hands in a series of interactive geometry lessons. Through the use of different math manipulatives, children investigate the properties of rectangles,...
Kenan Fellows
Use of Dichotomous Keys to Identify Stream Organisms
What kind of organisms are living in the stream? After an explanation on how to use a dichotomous key, groups of three to four use the keys to identify macroinvertebrates from a local freshwater stream. Using the the concept of Stream...
University of Georgia
Using Freezing-Point Depression to Find Molecular Weight
Explore the mathematical relationship between a solvent and solute. Learners use technology to measure the cooling patterns of a solvent with varying concentrations of solute. Through an analysis of the data, pupils realize that the rate...
CK-12 Foundation
When to Use the Distributive Property: Rational Expressions
Discover how the distributive property applies to division. As learners change numeric values within an expression, the simulation calculates its value. Challenge questions lead individuals to realize the power of distributing the...


