Curated OER
District Decisions
Young scholars review census data and examine the manner in which reapportionment and redistricting occurs. They, in groups, debate a proposed change in the way congressional districts are drawn and present their debates to the class.
Curated OER
Censusmania
Students discover the meaning of census, discuss the 2000 census, and the importance of filling out the form and returning it to the census bureau. They review the census sheet from New Castle County in 1850, observing the headings of...
Curated OER
U.S. Population Hits 300 Million
Students read a story about the population in the United States reaching 300 million, and answer vocabulary and comprehension questions about it. For this population lesson plan, student respond to literature by answering questions,...
Curated OER
Population Pyramids
Students utilize population pyramids to answer questions, make comparisons, draw conclusions and support predictions about the populations of China, India and the Unites States. They arrange numbers and symbolic information from various...
Curated OER
Using Real-Data from North Dakota to Study Place Value, Rounding, Estimation, Fractions, and Percents
In this real-data activity, learners use data from the 2008 Census Bureau to answer eight questions divided into four activities. The topics covered include: place value, rounding, estimation, fractions, and percents.
US Department of Commerce
Looking at Numbers of Births Using a Line Graph
Was there a baby boom? Using census data, class members take a look at the number of 8-11 year olds and determine their birth years. Scholars create a double line graph to compare the number of births for two states for several years....
Curated OER
Census Statistics and Graphing
Learners graphically represent data from the Census. In this middle school mathematics lesson plan, students investigate the housing characteristics of different tribes of Native Americans and compare them to the average American...
Curated OER
Population Pyramids
Students work with and make population pyramids. In this population pyramid lesson plan, students use census data to make population pyramids for China, India, and the United States. They use the information to determine why jobs are...
PBS
What We Do Adds Up
With so many tons of trash going into landfills each year, your environmentalists can calculate how much the average person is tossing away. This activity has a series of questions not only requiring math, but a conscious thought of how...
Curated OER
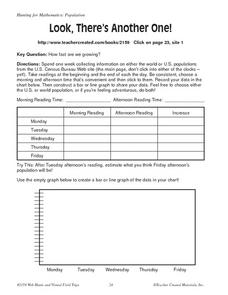
Look, There's Another One!
In this math worksheet, students spend a week collecting information on either the word or U.S. populations from the U.S. Census Bureau Web site. Students record their data in a chart and bar graph. Students also use the website to...
Curated OER
Size It Up: Map Skills
Compare information from a US population cartogram and a standard US map. Learners draw conclusions about population density by analyzing census data a population distribution. They discover that census data is used to apportion seats in...
Curated OER
Where You Belong
Young scholars identify different groups to which they belong, and use counting techniques to take a census of their family and class.
Curated OER
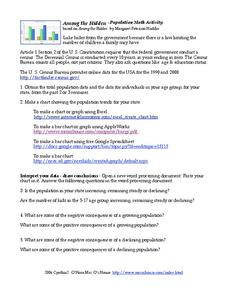
Among the Hidden - Population Math Activity
In this population worksheet, students collect data on population by researching the Census Bureau and then make online graphs and answer short answer questions about the data. Students complete 5 problems total.
Curated OER
Samples and Stats
Students explore different methods of taking surveys and conducting polls and examine these methods for bias. They design and administer a sample survey, analyze the data and present their findings to the class.
Curated OER
Kids Count
Students read special purpose map, use place value to hundred thousands, and write numbers to hundred thousands.
Curated OER
Censusmania
Students understand how the census can reveal information about people and history. They create their own census.
Curated OER
Modeling Population Growth
Students investigate the reasons for taking a census and determine the problems that are involved in the process. They examine the population figure for Montana and Lake county before using the information to complete the included...
Curated OER
Committing to Respect: Lessons for Students to Address Bias
Here's a guide designed to build safe, respectful learning environments, and to build understanding of the value of diversity through lessons packed with activities for specific grade levels.
Curated OER
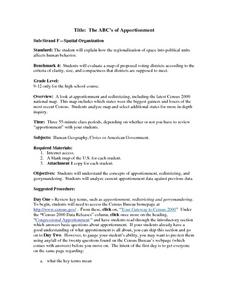
The ABC's of Apportionment
Students are introduced to the terms of apportionment and redistricting. Using a Census map, they identify the states that had the highest and lowest numbers of change during the past ten years. They examine a map of voting districts and...
Curated OER
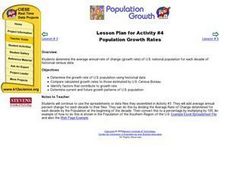
Population Growth Rates
Students determine the average annual rate of change (growth rate) of U.S. national population for each decade of historical census data.
Curated OER
Technology - Data Collection
Students collect and analyze data from the United States Census Bureau. Using spreadsheet technology, students explore their results and make preductions about income groups. Students compute the mean, median and mode. They create...
Curated OER
Celebrate Hispanic Heritage Month!
Students use information from the U.S. Bureau of the Census to create a bar graph, a picture graph, or a circle graph showing the country of origin of U.S. Hispanics.
Curated OER
Questions for Today: Communities
Students discover how questionnaires help communities to determine the needs of its citizens. They make an analogy between a survey of students about their school and a survey of citizens about their community.
Statistics Education Web
Types of Average Sampling: "Household Words" to Dwell On
Show your classes how different means can represent the same data. Individuals collect household size data and calculate the mean. Pupils learn how handling of the data influences the value of the mean.


