Curated OER
Focus on Economic Data: US Employment and the Unemployment Rate, March, 2012
Read all about the various types of unemployment and the United States is are currently at the low-point of an unemployment cycle. Kids examine what economic factors affect the unemployment rate, and what data shows for different US...
Curated OER
A Slice of the Census
Students learn why the census makes a difference. In this U.S. Census lesson plan, students examine the importance of each census question and explain the measures taken to protect the confidentiality of personal information on the census.
Curated OER
The U.S. Census
For this U.S. Census Worksheet, students read a passage regarding the U.S. Census and answer the following 10 multiple choice questions.
Curated OER
Projections and the Census
Students learn why the census makes a difference. In this U.S. Census lesson plan, students connect data and history in their study of previous population booms and analyze census data in order to make predictions about the future.
Curated OER
Getting Active in the Census
Students learn why the census makes a difference. In this U.S. Census lesson plan, students identity ways to participate in the 2010 Census while they understand the need the need for citizen action to reduce the risk of undercounts.
Curated OER
The Role of Individuals and Groups in the Census
Young scholars learn why the census makes a difference. In this U.S. Census lesson plan, students describe and explain the roles that individuals, government agencies, and partner groups play in the census.
Curated OER
Lesson 1: Map Data and the Census
Learners learn about the history of the census. For this U. S. Census lesson plan, students develop an understanding about how the United States Constitution grants and distributes power and discover how the spatial organization of...
Curated OER
Race and Ethnicity in the United States
Students explore race and ethnicity as it is defined by the U. S. Census Bureau. They compare data from 1900, 1950, and 2000 and identify settlement patterns and changes in population. In groups, they map these changes and discuss...
Curated OER
Celebrating Our Nation's Diversity
Second graders conduct a class census to measure diversity.
PBS
What We Do Adds Up
With so many tons of trash going into landfills each year, your environmentalists can calculate how much the average person is tossing away. This activity has a series of questions not only requiring math, but a conscious thought of how...
Curated OER
Committing to Respect: Lessons for Students to Address Bias
Here's a guide designed to build safe, respectful learning environments, and to build understanding of the value of diversity through lessons packed with activities for specific grade levels.
Curated OER
Using Real-Data from North Dakota to Study Place Value, Rounding, Estimation, Fractions, and Percents
In this real-data activity, learners use data from the 2008 Census Bureau to answer eight questions divided into four activities. The topics covered include: place value, rounding, estimation, fractions, and percents.
Curated OER
Size It Up: Map Skills
Compare information from a US population cartogram and a standard US map. Learners draw conclusions about population density by analyzing census data a population distribution. They discover that census data is used to apportion seats in...
Curated OER
Censusmania
Students understand how the census can reveal information about people and history. They create their own census.
Curated OER
Count On Us: Concepts and Applications of Demography
Eighth graders use the Internet to research demographics of certain areas. They use the U.S. Census Bureau's website to help them gather information. They use their data to find a solution to a hypothetical problem.
Curated OER
Biggest US City by Letter Quiz
In this online interactive geography quiz activity, learners respond to 26 identification questions about U.S. cities. Students have 5 minutes to complete the quiz.
Curated OER
Chief Joseph and the Nez Perce
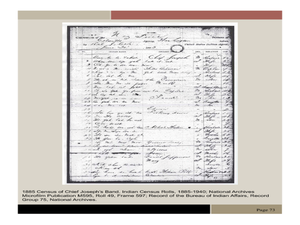
Eleventh graders explore the life of Chief Joseph and Nez Perce. In this US History lesson, 11th graders analyze paintings and photos detailing the flight of Nez Perce. Students create a narrative newspaper article based on their...
Curated OER
Black Women in Delaware's History
Students study the number of slaves in the US in 1790 by state and answer questions. They imagine that they were an enslaved African American women and determine how their life changed when slavery ended.
Curated OER
Race and Crime in the United States: Are We Victims of Discrimination or Antiheroes?
Using methods adopted by Public Policy Analysts (PPA) class groups define a social problem, gather evidence to document the existence of the problem, identify causes, evaluate existing policies designed to deal with the problem, develop...
Curated OER
Population Pyramids
Students explain the significance of population trends on world regions. They define relevant population vocabulary and examine age-gender patterns at various scales.
Curated OER
The Brief American Pageant: The Stormy Sixties
Intended for use with The American Pageant by David Kennedy, Lizabeth Cohen, and Mel Piehl, this slideshow includes maps and graphs that detail politics and social dynamics in 1960's America. The textbook is not necessary for...
Curated OER
The Brief American Pageant: The American People Face a New Century
The political landscape of Y2K is the focus of this series of slides, which cover the later years of the 20th century. Charts detail the poverty and social welfare rates in the 20th century, as well as a pie graph displaying the sources...
Curated OER
Where Do I Want To Live?
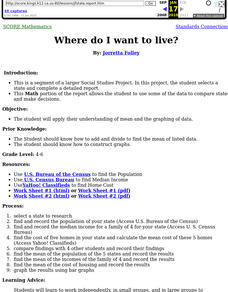
Learners use a variety of Internet sources to gather income, population and housing data. Each group bring their results to the class and the class use their findings to compile mean population, income, and housing for all states.
Curated OER
Cultural Practices and Products of the Local Community
Third graders examine and compare practices and products of the cultural groups that have settled in the local area. Students develop and use graphic organizers to aid them in the comparison of artistic expression, places of worship,...


