Creative Visions Foundation
Studying Documentaries Like a Writer - Looking For Persuasive Techniques
Revisit the documentaries viewed in the previous lesson in this series in order to take a look at the persuasive techniques employed by the documentary creators. Small groups watch the films a second time, taking notes on two provided...
Curated OER
Fantasy Baseball
Check out this thematic unit, based on the game of baseball. Learners investigate numbers and number relations as they become familiar with some of the basic terminology associated with the game. They focus their attention on actual...
Curated OER
Graph It!
There is more than one way to represent data! Learners explore ways to represent data. They examine stacked graphs, histograms, and line plots. They conduct surveys and use stacked graphs, histograms, or line plots to chart the data they...
Curated OER
Populations Lab - Cultures Lesson: Statistics / Sampling Patterns
Ninth graders examine the application of statistical sampling, data collection, analysis, and representation that exists in schooling and teenage lifestyles in Japan and the United States.
Curated OER
Music and Animation: 200 Greatest Pop Culture Icons
Music has been used to convey thoughts, feelings, and the human condition for thousands of years. Your class will analyze several songs hear in the animated classic, "Charlie Brown." They will listen to several jazz pieces from the show,...
Curated OER
Using Your Marbles - Volume Measurement and Reporting
Demonstrate how to measure the volume of liquids and solids immersed in liquid to your class. They observe a teacher-led demonstration, and in small groups construct a data table that demonstrates how many marbles were used and the...
Curated OER
Pike Problems in Lake Davis
Pike fish pose a threat to native trout and catfish in lakes. Would you drain and poison a lake to get rid of the Pike fish? If the lake was drained and poisoned, then refilled and repopulated with trout and catfish, how would you...
Annenberg Foundation
Skeeters Are Overrunning the World
Skeeters are used to model linear and exponential population growth in a wonderfully organized lesson plan including teachers' and students' notes, an assignment, graphs, tables, and equations. Filled with constant deep-reaching...
Curated OER
Getting to Know Characters
This set of worksheets constitutes enough work and materials to be considered a lesson. They guide readers through a process of exploring characters and their motivations, and writing a paragraph about them. Here are seven handouts that...
Student Handouts
Compare and Contrast Chart with Bubble Map
Take your traditional Venn diagrams and mind maps to the next level with this unique bubble map! The graphic organizer allows students to compare and contrast several aspects of two concepts, encouraging a more in-depth analysis overall.
Curated OER
Graphing and Analyzing Biome Data
Students explore biome data. In this world geography and weather data analysis lesson, students record data about weather conditions in North Carolina, Las Vegas, and Brazil. Students convert Fahrenheit degrees to Celsius degrees and use...
The New York Times
Evaluating Sources in a ‘Post-Truth’ World: Ideas for Teaching and Learning about Fake News
The framers of the United States Constitution felt a free press was so essential to a democracy that they granted the press the protection it needed to hold the powerful to account in the First Amendment. Today, digital natives need to...
Curated OER
Character Sketch Chart
What does Candy look like? What kind of a person is Curley? What is Slim's dream? Readers of Of Mice and Men take their turn at characterization by creating a sketch chart for each of the major characters in Steinbeck's classic novel....
Curated OER
Tables
Can you read this table? Learners begin to comprehend data analysis through examining two simple tables and answering comprehension questions. The first gives characteristics about three animals in yes-or-no format (i.e. "eats insects,"...
Curated OER
Sound Walk: Discovering Data and Applying Range, Mode, and Mean
Elementary schoolers sharpen their listening skills as they use sound maps, tallies, and line plots to organize and interpret data. Everyone takes a "sound walk," and focuses on the sounds around them. They chart and tabulate the sounds...
EngageNY
Interpreting and Connecting Information: Creating a Cascading Consequence Chart Using Frightful’s Mountain
Decisions, decisions. Scholars take a close look at making decisions by discussing the character Sam in chapters one through eight of Frightful’s Mountain. Partners discuss whether Sam should interact with Frightful and then complete a...
Curated OER
Reading Charts
How well can your third graders interpret data from a chart? Use this straightforward activity to reinforce problem-solving skills. After reading a school schedule, pupils answer ten questions about the information in the chart. A great...
Curated OER
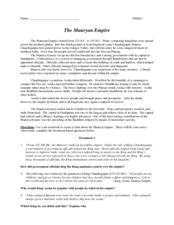
The Mauryan Empire
Create a chart about the Maurayan Empire. Read the provided passage, make a chart, then analyze 3 excerpts. Questions need to be answered for each of the primary source excerpts. Making a reading chart is a good way to take notes!
EngageNY
Using Multiple Resources of Information: Creating a Cascading Consequences Chart about DDT and Practicing a Fishbowl Discussion
For every action there is a consequence. Scholars continue their work on creating a cascading consequence chart about DDT using Welcome Back, The Exterminator, Rachel Carson: Sounding the Alarm on Pollution along with graphic organizers...
Curated OER
Quantitative Data
In this quantitative data worksheet, pupils compute measures of central tendency, draw vertical line diagrams, and compare collected data. This 23-page worksheet contains approximately 100 multi-step problems. Explanations and examples...
Curated OER
Santa's Route
In this route worksheet, learners observe a chart of Santa's route and answer word problems about the distance he travels between cities. They complete six problems.
Curated OER
Graphs
For beginners to picture graphs this is the perfect resource. They analyze two bar graphs that break down data visually so scholars can actually count the number in each column. For the first, they fill in how many of each type of pet is...
Curated OER
Bar Graphs
Introduce scholars to bar graphs and data analysis through analyzing these visual examples. First, they look at a pictograph of fruit types and answer five observation questions. There is one done for them as an example. Learners do the...
Curated OER
Reading Tables
Who is two years younger than Meg? Who is older than Paul, but not Kinta? Scholars practice reading tables as they answer comprehension questions based on three sets of data. First, they examine a table depicting ages, then favorite...


