Curated OER
Worksheet 4: Graphs and One-Sided Limits
In this math worksheet, students answer 6 questions regarding functions, graphs, one-sided limits, intercepts, vehicle speed and wheel rotation.
Curated OER
Parent Functions Review Sheet
No laundry or cooking dinner here: these parent functions are all about math. Every graph you could think of from basic linear functions to the hyperbolic arccotangent function are included. With 40 parent functions, the worksheet can be...
EngageNY
Increasing and Decreasing Functions 1
Model situations with graphs. In the fourth installment of a 16-part module, scholars learn to qualitatively analyze graphs of piecewise linear functions in context. They learn to sketch graphs for different situations.
Shodor Education Foundation
Function Flyer
Fly through graphing functions with the Function Flyer. Young mathematicians use an interactive to graph different types of functions. A set of exploration questions has users investigate patterns in functions.
Annenberg Foundation
Skeeters Are Overrunning the World
Skeeters are used to model linear and exponential population growth in a wonderfully organized lesson plan including teachers' and students' notes, an assignment, graphs, tables, and equations. Filled with constant deep-reaching...
University of North Texas
Library of Functions
Join the family picnic and see how all the functions come together in a PowerPoint that highlights their main features. As it includes topics such as domain, range, and intercepts, the slides are a great guide to promote class discussions.
Illustrative Mathematics
Introduction to Linear Functions
Introduce your algebra learners to linear and quadratic functions. Learners compare the differences and relate them back to the equations and graphs. Lead your class to discussions on the properties of a function or a constant slope...
EngageNY
Constant Rate
Two-variable equations can express a constant rate situation. The instructional activity presents several constant rate problems. Pupils use the stated constant rate to create a linear equation, find values in a table, and graph the...
Concord Consortium
Functions by the Slice
Piece by piece ... dismantling a function can highlight interesting patterns. The task asks learners to slice functions in sections with the same vertical change. They then recreate the graph with these slices positioned horizontally....
EngageNY
Stretching and Shrinking Graphs of Functions
Why is that graph wider? Pupils learn about stretching and shrinking graphs of square root, absolute value, cubic, and quadratic functions. They study both vertical and horizontal stretches and shrinks in addition to reflections.
EngageNY
Graphs of Quadratic Functions
How high is too high for a belly flop? Learners analyze data to model the world record belly flop using a quadratic equation. They create a graph and analyze the key features and apply them to the context of the video.
Shodor Education Foundation
Multi-Function Data Flyer
Explore different types of functions using an interactive lesson. Learners enter functions and view the accompanying graphs. They can choose to show key features or adjust the scale of the graph.
CPM
How to Recognize the Type of Graph from a Table
Linear, quadratic, and exponential functions are represented only by their table of values in this simple, well-written instructional activity. Learners decide the type of graph represented based on the differences in the function...
Mt. San Antonio Collage
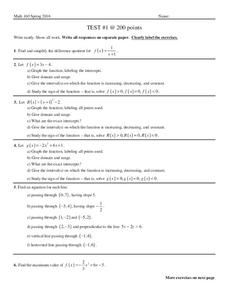
Test 1: Graphing Functions
Graph the night away with all the different types of functions provided in the worksheet. Linear, quadratic, and rational all ask for graphs, domain and range and other key factors about the functions.
West Contra Costa Unified School District
Families of Functions Sort
Have some fun with functions with a short activity that asks learners to first sort scatter plot in terms of their correlation. They then sort graphs of different types of functions in terms of key features, such as slope.
Concord Consortium
Function Project
What if a coordinate plane becomes a slope-intercept plane? What does the graph of a linear function look like? Learners explore these questions by graphing the y-intercept of a linear equation as a function of its slope. The result is a...
Shodor Education Foundation
Two Variable Function Pump
Use a function to operate on two variables. Pupils look at operating with complex numbers as a function of two variables. The interactive squares the input and adds a constant to it. Learners visualize the resulting output and its...
EngageNY
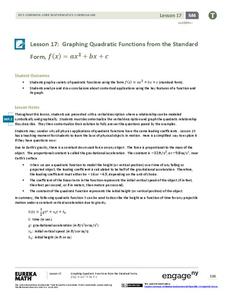
Graphing Quadratic Functions from the Standard Form
Use context to explain the importance of the key features of a graph. When context is introduced, the domain and range have meaning, which enhances understanding. Pupils use application questions to explore the key features of the graph...
EngageNY
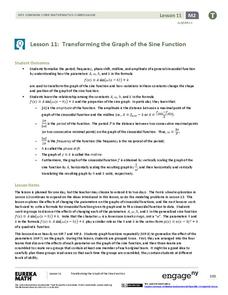
Transforming the Graph of the Sine Function
Build a solid understanding of trigonometric transformations through exploration. Learners work in teams to analyze the effects of different algebraic components on the graph of a sine function.
University of Texas
A Library of Parent Functions
Don't think this lesson is for Mom and Dad; parent functions are all for your high schoolers. Flip through a presentation with a focus slide on each type of graph and its characteristics. Some examples are included but the focus is on...
EngageNY
Translating Graphs of Functions
If you know one, you know them all! Parent functions all handle translations the same. This lesson examines the quadratic, absolute value, and square root functions. Pupils discover the similarities in the behavior of the graphs when...
EngageNY
Linear Functions and Proportionality
Connect linear equations, proportionality, and constant rates of change to linear functions. Young mathematicians learn how linear equations of the form y = mx + b can represent linear functions. They then explore examples of linear...
EngageNY
Graphs of Functions and Equations
Explore the graphs of functions and equations with a resource that teaches scholars how to graph functions as a set of input-output points. They learn how the graph of a function is the graph of its associated equation.
EngageNY
Graphs of Simple Nonlinear Functions
Time to move on to nonlinear functions. Scholars create input/output tables and use these to graph simple nonlinear functions. They calculate rates of change to distinguish between linear and nonlinear functions.


