Curated OER
Identifying Linear Functions from Graphs
Keep your mathematicians engaged using this group linear functions activity. Each of ten groups receives two graphs with both an image and equation, as well as a "who has" phrase to call out the next graph. Scholars stay on their toes as...
CK-12 Foundation
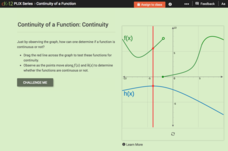
Continuity of a Function: Continuity
Does the point continually move along the graph? Pupils drag a line across two functions to determine whether they are continuous or not. They answer questions about the properties of continuous and discontinuous functions. Using their...
CK-12 Foundation
Graphs for Discrete and for Continuous Data: Discrete vs. Continuous Data
Not all data is the same. Using the interactive, pupils compare data represented in two different ways. The learners develop an understanding of the difference between discrete and continuous data and the different ways to represent each...
Willow Tree
Line Graphs
Some data just doesn't follow a straight path. Learners use line graphs to represent data that changes over time. They use the graphs to analyze the data and make conclusions.
CK-12 Foundation
Input-Output Tables for Function Rules
How does changing a graph affect the function? Learners watch the changing input-output table as they adjust the location of the line graph. Questions prompt them to complete a table of values and determine the function rule.
Curated OER
Worksheet 9 - Functions
In this function worksheet, students explain continuous and noncontinuous function and graph derivatives. This two-page worksheet contains seven multi-step problems.
Inside Mathematics
Graphs (2006)
When told to describe a line, do your pupils list its color, length, and which side is high or low? Use a instructional activity that engages scholars to properly label line graphs. It then requests two applied reasoning answers.
Illustrative Mathematics
Introduction to Linear Functions
Introduce your algebra learners to linear and quadratic functions. Learners compare the differences and relate them back to the equations and graphs. Lead your class to discussions on the properties of a function or a constant slope...
EngageNY
From Ratio Tables, Equations and Double Number Line Diagrams to Plots on the Coordinate Plane
Represent ratios using a variety of methods. Classmates combine the representations of ratios previously learned with the coordinate plane. Using ratio tables, equations, double number lines, and ordered pairs to represent...
CK-12 Foundation
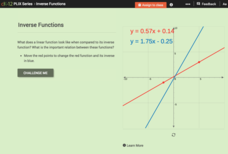
Inverse Functions
Provide a graphical view of inverses. Pupils manipulate points on a line and see the relationship of the graph with the graph of its inverse. Using the relationship between the graphs, scholars respond to questions concerning inverses...
EngageNY
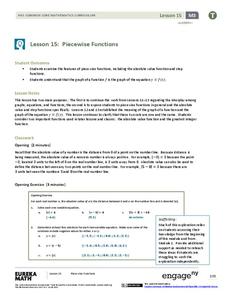
Piecewise Functions
Show your class members that if they can graph a linear function, they can graph an absolute value function. Groups create an absolute value graph using a table, then entertain the idea of an absolute value function defined as two pieces...
CK-12 Foundation
Even and Odd Functions and Function Symmetry: Even and Odd Functions (Symmetry)
Even money states that the resource is good to use. Scholars manipulate an interactive to adjust the portion of a graph to the left of the y-axis. The interactive allows them to switch between even and odd modes that show the right side...
CK-12 Foundation
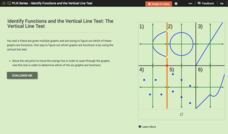
Identify Functions and the Vertical Line Test: The Vertical Line Test
There's no easier test than the vertical line test. Learners drag a vertical line across the graphs of several relations in an interactive. They answer a set of challenge questions that focus on whether the graphs represent functions.
CK-12 Foundation
Evaluate Limits Using Graphs and Tables: Where Is That Limit?
Limits are made easy through graphs and tables. An easy-to-use interactive lets users change a function on a coordinate plane. They relate graphs and tables to the limit at a specific value.
West Contra Costa Unified School District
Graphing Piecewise Functions
Step up to learn about step functions. The lesson, designed for high schoolers, first covers piecewise functions and how to draw their graphs. It then introduces step functions, including the greatest integer (floor) and ceiling functions.
CK-12 Foundation
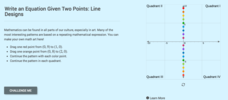
Graphs of Linear Functions: Line Designs
Designs from lines are sublime. Scholars create colorful designs by connecting points on an interactive coordinate plane. They answer questions about slope and quadrants based on their designs.
CK-12 Foundation
Vertical Line Test: Exploration
What do vertical lines have to do with functions? Individuals slide a vertical line through four different graphs. They use that vertical line test to determine if the graphs represent functions.
CK-12 Foundation
Existence: One-to-One Functions and Inverses
One-to-one means the answer is simple, right? Given four graphs, pupils use a vertical line to test each graph to find out if they are one-to-one. By using the resource, learners realize that not all one-to-one relations are functions....
CK-12 Foundation
Inverse Functions: Definition of Inverse Functions
Is the inverse of a function also a function? Pupils manipulate the graph of a function to view its inverse to answer this question. Using a horizontal and vertical line, class members determine whether the initial function is...
Curated OER
When Ants Fly
Here is a great lesson on constructing line graphs. Learners identify common characteristics of birds, ants common needs of all living things. They also write a story from the perspective of an ant or a bird that has lost its home and...
CK-12 Foundation
Linear and Non-Linear Function Distinction: Domain and Range of a Function
Functions are special types of relations, but what makes them so special? Pupils use an interactive to slide a vertical line across six different graphs. Ten challenge questions then assess understanding of functions.
Curated OER
Domain and Range
Relations, and functions, and line tests, oh my! An instructional slideshow demonstrates the definitions of a relation, a function, and the domain and range of a relation. Viewers then learn how to use mappings and vertical line tests to...
Balanced Assessment
A Run for Two
Develop a graph to represent the distance between two cars. The assessment task presents a scenario in which two cars are traveling at constant speeds with one faster than the other. Pupils develop graphical representations to show the...
Curated OER
Graphing Linear Equations Cards
OK, so maybe graphing linear equations can be fun. This activity includes a set of linear equation cards to be cut and place face up on a table. Learners pick a card and match it to the correct graph card. This is a really fun way to...


