Curated OER
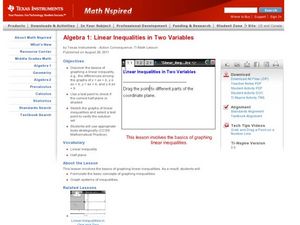
Linear Inequalities in Two Variables
Graph and solve linear equations in two variables. The class relates the concepts of linear equations to the real world.
Teach Engineering
Exploring Variables While Testing and Improving Mint-Mobiles (for High School)
Mint candies are good for more than just one's breath. Using basic materials such as mint candies, straws, index cards, and Popsicle sticks, scholars create race cars that meet a given budget as well as design constraints. They perform...
NASA
Ascent: 50 Seconds to MECO
All systems go! With a video and a Google Earth tour as background, pairs investigate two graphs. The graphs display acceleration vs. time and velocity vs. time of a space shuttle launch. Using graphing calculators, the pairs take a...
Curated OER
How Can Entrepreneurs Control Costs?
Students calculate fixed and variable costs. In this costs lesson, students read a case study about an entrepreneur and her business costs. Individuals complete the provided worksheets to find costs and make related business decisions....
Curated OER
Making a Line Graph
In this line graph activity, students use data given in a table and assign axes, make a scale, plot data and make a line or curve on their constructed graphs.
Curated OER
Linear Inequalities in One and Two Variables: Rays and Half Planes
Define rays and half planes, including the concepts of boundary lines and prerequisite knowledge of coordinate planes. Given linear inequalities in one and two variables, your class will compare the differences. They will also graph...
Curated OER
Two-Variable Linear Inequalities
Here is an engaging lesson plan on solving equations with two variables. Have the class rewrite linear equations in the slope intercept form, y=mx + b. They graph the lines using the slope and y-intercepts.
Curated OER
Interpreting Data-Working with Controls and Variables
Pupils review the meaning of control and variables, and state difference between dependent and independent variables. They complete a worksheet with the definitions and complete problems that show their understanding.
Curated OER
Generating Hypotheses and Experimental Design 1
Here is a thorough exercise in forming hypotheses for scientific investigations. Young scientists consider factors that may be related to the question they would like to address. They think through measurable changes that may result from...
Curated OER
Algebra I: Linear Functions
Using rates from a rental car company, young mathematicians graph data, explore linear relationships, and discuss the role of slope and the y-intercept. This lesson plan allows for the discussion of independent and dependent variables,...
Curated OER
Perimeter Pattern
High schoolers investigate perimeter patterns formed by a hexagon and a triangle. They will identify the dependent and independent variable and write a function for the relationship.
Curated OER
Point Graphs
Students experiment with point graphs. In this math lesson, students are divided into groups and perform an experiment to see how high a ball bounces, recording their results on a point graph. Students then answer provided questions.
Curated OER
Experiment Report (Normal Form)
Here is a handy handout to give any science class as a guide to writing lab reports. It is a blank outline that you can have aspiring scientists fill out when they experiment, or imitate as they record their experiments in a lab journal....
Curated OER
Graphing Pendulum Results
Sixth graders set up a pendulum experiment deciding which variable to manipulate (length of string or weight on the string). They create a hypothesis, collect necessary equipment, and write out each step of their experiment. They then...
Curated OER
Environmental Graphing
Students experiment with graphing. For this graphing introduction lesson, students complete four activities: 1) a bar graph based on class birthdays 2) an estimation graph of the raisins in raisin bread 3) another estimation example with...
Curated OER
Solving Problems
In this solving problems worksheet, students answer twelve multiple choice questions about problem solving in science and the steps of the scientific method. These include identifying the problem, forming a hypothesis and setting up the...
Curated OER
Curve Ball
Create a Height-Time plot of a bouncing ball using a graphing calculator. Graph height as a function of time and identify the vertex form of a quadratic equation that is generated to describe the ball's motion. Finally, answer questions...
Curated OER
Pendulum Lab in 9th Grade Physical Science
Ninth graders conduct experiments to determine what affects the rate of a pendulum's swing. Working in small groups, they identify an independent variable to study and create an experiment to test their hypothesis. When tests are...
Curated OER
Making Connections-Review Experimental Design and Homeostasis
In this experimental design and homeostasis worksheet, students complete 20 sentences with key terms about designing experiments, gathering data, graphing data and determining controls. They also complete sentences about homeostasis and...
Curated OER
How Much Sugar is in Bubble Gum?
Students conduct an experiment to determine the percentage of sugar in various types of gum. They weigh the gum after chewing it to determine the amount of mass lost from each piece of gum, analyze the data, and create a graph of the...
Curated OER
Experimental Design Practice
In this experimental design activity, students are given two experimental scenarios to read. They answer questions about each including finding the hypothesis, the independent and dependent variables and controls. They design a graph for...
Curated OER
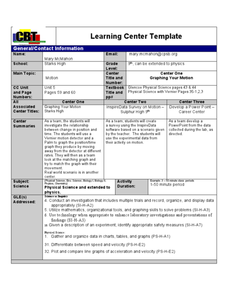
"Graphing Your Motion"
Students study the concepts of motion, velocity, and acceleration through graphing their own movement using LoggerPro. They explain the difference between speed and velocity using the weather vane example. They discover the difference...
CPO Science
Science Worksheets
If you need an array of worksheets to augment your science lessons, peruse a collection of assignments that is sure to fit your needs. With topics such as metric conversion, the scientific method, textbook features, research skills,...
Curated OER
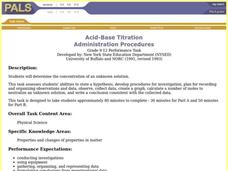
Acid-Base Titration
Students determine the concentration of an unknown solution. This task assesses students' abilities to state hypothesis, develop procedures for investigation, plan for recording and organizing observations and data, collect data, create...


