Curated OER
A World of Information
Students analyze data and statistics about countries around the world. They read graphs and charts, color a world map to illustrate the top ten statistics about the world, and write a paragraph to summarize their information.
Curated OER
Math Lesson: What Do You Want to Know? - Country Statistics
Young scholars are able to identify the characteristics of a variety of graphs (i.e. bar graph, line graph, pie graph, scatter plot, population pyramids, etc.) They recognize how the type of data to be presented plays a role in choosing...
Mesa Public Schools
Country Project
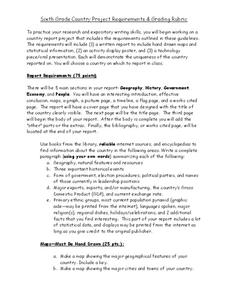
Give your young learners the chance to discover more about countries in their world community with a research project. Class members write reports on an assigned country and include such major features as geography, important historical...
Curated OER
Did Voters Turn Out -- or Are They Turned Off?
What was the voter turnout at your last state election? Examine voter turnout statistics from the most recent election to learn which ten states have the best turnout record. This lesson offers election data, handouts, and worksheets.
Curated OER
Statistics
Seventh and eighth graders solve and complete three various types of problems. First, they find the median rate using the box-and-whisker plot shown. Then, learners describe the inter-quartile range. In addition, they determine whether...
Curated OER
Statistics Related to the First World War
In this history and probability worksheet, students examine a chart of statistics associated with World War I which include total of men in the war by nation, number of deaths, and number of men taken prisoner. They answer 5 questions...
Curated OER
Analyzing Country Data
Learners analyze different data in percentage form. In this statistics lesson, students plot data using box-plots, dotplot, and histogram. They compare and contrast the collected data using the boxplot.
Curated OER
A Statistical Study by Adolescent Students on Relevant Issues
Students use statistics to study attributes of a local center for pregnant teenagers. They apply mean, median, mode and a correlation study between two variables.
Curated OER
Microsoft Publisher Country Brochure
Learners explore geographic information. In this geography and technology instructional activity, students choose a county and answer related questions on a Webquest. Learners create a word web and design a country brochure.
Curated OER
Country Comparison Chart
In this country comparison worksheet, students use their research skills to find the population, per-capita GDP, urban numbers, rise in population, literacy rate, and life expectancy of the each of the 10 nations listed.
Curated OER
Writing Skills: Statistical Report
A simple text analysis lesson, language learners transfer, order, and group information so that it is presentable. No apparent link to the five required worksheets.
Curated OER
Comparing School Bus Stats
Engage in a lesson plan that is about the use of statistics to examine the number of school buses used in particular states. They perform the research and record the data on the appropriate type of graph. Then they solve related word...
Alabama Department of Archives and History
A Worse Death: War or Flu?
In a instructional activity that integrates history and mathematics, class members create graphs that compare military death statistics from World War I with those that resulted from the influenza pandemic of 1918.
Advocates for Human Rights
Undocumented Immigrants
Stay or go? As part of a study of immigration and human rights, class members listen to the stories of several immigrants and must decide if the story was their own if they would stay in the United States as an undocumented immigrant or...
Curated OER
World War I: The War to end all Wars
Recap your WWI unit with this presentation. Provided are major war-time statistics, causes/results of the war, a list of countries involved, and escalation. This would be best used as a review tool.
Curated OER
EU and Turkey
Should Turkey be admitted to the European Union? Before debating this question, class members research the background and stated purpose of the EU, read articles of Turkey's bid to become a member of the EU, and the concerns other...
Global Oneness Project
A Day in the Life
We often see other countries depicted in movies, but getting a close look at a typical day in the life of a young person from another country isn't as common. Give your pupils such a look with a resource that helps class members explore,...
Curated OER
Challenge: Agenian Ages-Statistics
In this statistics/data worksheet, students use given statistics of people from a fictional planet to answer 6 related questions.
Curated OER
Handling Data- Health Statistics
In this social studies worksheet, students organize 50 country cards into groups. Students analyze a chart and group countries according to lowest, middle, and highest Infant Mortality Rate.
Curated OER
Using Articles with Names of Countries
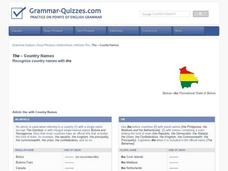
In this using articles with names of countries worksheet, students read the explanations and examples of using the with names of countries, then interactively select the correct article for 20 countries with immediate online feedback and...
Curated OER
Assessing Quality of Life
Eleventh graders research quality of life indicators for a list of countries looking at such things as infant mortality rate, and gross domestic product. They rank the countries from best to worst regarding quality of life issues.
Curated OER
Science on the Skids
Students discuss the decline in the sciences in America by comparing statistics and information from the U.s. to other countries. Then they write and deliver a "State of the Sciences" address to their peers.
Curated OER
Data Collection
Students investigate qualitative and quantitative data. In this statistics lesson, students gather data on heights and weights of people and graph the distribution. Students discuss the differences between qualitative and quantitative data.
Curated OER
Global Statistics
Students determine statistics based on data. In this statistics lesson, students use data and record in charts. Students create graphs based on the statistics found.


