EngageNY
Modeling with Quadratic Functions (part 1)
Relevance is key! The resource applies quadratic modeling by incorporating application of physics and business. Pupils work through scenarios of projectile motion and revenue/profit relationships. By using the key features of the graph,...
EngageNY
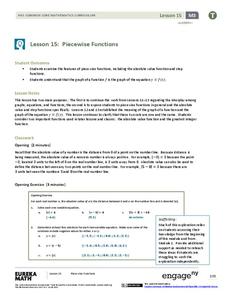
Piecewise Functions
Show your class members that if they can graph a linear function, they can graph an absolute value function. Groups create an absolute value graph using a table, then entertain the idea of an absolute value function defined as two pieces...
Discovery Education
Fuss About Dust
Dust is everywhere around us; it's unavoidable. But what exactly is dust and are certain locations dustier than others? These are the questions students try to answer in an interesting scientific investigation. Working independently or...
EngageNY
Comparing Quadratic, Square Root, and Cube Root Functions Represented in Different Ways
Need a real scenario to compare functions? This lesson has it all! Through application, individuals model using different types of functions. They analyze each in terms of the context using the key features of the graphs.
National Security Agency
What’s Your Coordinate?
Your middle schoolers will show what they know with their bodies when they become the coordinate plane in this conceptual development unit. Starting with the characteristics of the coordinate plane, learners develop their skills by...
Balanced Assessment
Melons and Melon Juice
Model the difference between the graphs of discrete and continuous functions. Scholars examine two scenarios and construct graphs to model the situation. They then compare their graphs that illustrate the subtle difference between these...
EngageNY
Multi-Step Problems in the Real World
Connect graphs, equations, and tables for real-world problems. Young mathematicians analyze relationships to identify independent and dependent variables. These identifications help create tables and graphs for each situation.
Concord Consortium
Function Project
What if a coordinate plane becomes a slope-intercept plane? What does the graph of a linear function look like? Learners explore these questions by graphing the y-intercept of a linear equation as a function of its slope. The result is a...
US Department of Commerce
Immigration Nation
People come and people go. Given tabular census data on the annual number of immigrants from four different regions of the world between 2000 and 2010, pupils create double bar graphs and line graphs from the data. They analyze their...
Balanced Assessment
A Loud Noise
In a scale measuring noise, an increase in 10 dB is a 10 time increase in power. Mathematicians examine the data graph of a real world exponential growth, with no logarithmic scale, and then create two equations relating the decibels and...
Chicago Botanic Garden
Climate Change Around the World
Look at climate change around the world using graphical representations and a hands-on learning simulation specified to particular cities around the world. Using an interactive website, young scientists follow the provided directions to...
Polar Trec
Beacon Valley Weather
In Beacon Valley, katabatic winds regularly knock fit adults to the ground. The lesson compares the actual temperatures to the wind chill after factoring in katabatic winds in Beacon Valley. Scholars learn to calculate wind chill and...
Curated OER
A Day at the Beach
Help learners determine the rate of change for the temperature of sand. They will collect data on the temperature of wet and dry sand over time with a heat lamp overhead. Then make a scatter plot of the data and find a linear model to...
Curated OER
Get Your Pupils Moving While Learning
Use these teaching strategies to get the wiggles out and keep the learning in!
EngageNY
Solution Sets to Equations with Two Variables
Can an equation have an infinite number of solutions? Allow your class to discover the relationship between the input and output variables in a two-variable equation. Class members explore the concept through tables and graphs and...
Shodor Education Foundation
Sequencer
Take the first step into graphing sequences. Learners set the starting number, multiplier, add-on, and the number of steps for a sequence. Using the inputs, the interactive calculates and plots the sequence on the coordinate plane. Users...
Alabama Department of Archives and History
A Worse Death: War or Flu?
In a instructional activity that integrates history and mathematics, class members create graphs that compare military death statistics from World War I with those that resulted from the influenza pandemic of 1918.
EngageNY
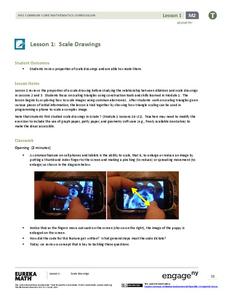
Scale Drawings
Are you searching for a purpose for geometric constructions? Use an engaging approach to explore dilations. Scholars create dilations using a construction method of their choice. As they build their constructed dilation, they strengthen...
Code.org
Encoding B and W Images
Imagine drawing with zeros and ones. The third instructional activity in a unit of 15 introduces the class to creating black and white images. Pairs get together to create an encoding scheme in order to make these images. They move on to...
Achieve
Ground Beef
Ever wonder how a butcher creates the different types of ground beef? Young mathematicians explore the methods butchers use to create their desired ground beef quality. Given a combination of two types of meat with varying leanness,...
Mathematics Vision Project
Module 8: More Functions, More Features
A piece of this and a piece of that, add domain restrictions and create a piecewise function. Young scholars explore piecewise functions with and without context. Functions include both linear and quadratic parts. The module is the...
Curated OER
Pike Problems in Lake Davis
Pike fish pose a threat to native trout and catfish in lakes. Would you drain and poison a lake to get rid of the Pike fish? If the lake was drained and poisoned, then refilled and repopulated with trout and catfish, how would you...
Illustrative Mathematics
Fishing Adventures 2
This resource is part of a series which expects participants to be familiar with graphing inequalities on a number line. It is a word problem that asks your class to graph a discrete solution set and interpret it in the context of an...
University of California
Seasons Lab Book
Unlock the mystery behind seasonal change with a collection of worksheets and activities. Whether they are drawing pictures of Earth's orbit around the sun or graphing the temperature and daylight hours of different locations from around...
Other popular searches
- Creating Graphs in Excel
- Interpreting Creating Graphs
- Creating Graphs in Ceil
- Creating a Graph Activity
- Creating Graphs and Charts
- Creating Graphs in Xcel
- Creating a Graph Worksheet
- Creating Graphic Scores
- Creating a Graphic Orgainzer
- Creating a Graphic Organizer
- Creating Bar Graphs Quiz
- Creating Graphs in Illustrator


