Illustrative Mathematics
Weather Graph Data
Teaching young mathematicians about collecting and analyzing data allows for a variety of fun and engaging activities. Here, children observe the weather every day for a month, recording their observations in the form of a bar graph....
Curated OER
Holiday Greeting Cards: A Graphing Activity
Students examine statistics about the popular type of greeting cards and create pie or bar chart using an online tool. They illustrate the sales statistics for the greeting cards before making the charts.
Curated OER
Graphing Groundhog Predictions
Young scholars create a bulletin board graph illustrating Punxsutawney Phil's past predictions. Students also perform research about past predictions. The learners also graph the predictions and answer questions about the data.
Illustrative Mathematics
Favorite Ice Cream Flavor
What better way to engage children in a math instructional activity than by talking about ice cream? Using a pocket chart or piece of chart paper, the class works together creating a bar graph of the their favorite ice cream flavors....
Baylor College
Water: The Math Link
Make a splash with a math skills resource! Starring characters from the children's story Mystery of the Muddled Marsh, several worksheets create interdisciplinary connections between science, language arts, and math. They cover a wide...
Curated OER
Generate Measurement Data Word Problems
Using a set of simple data, learners create a line plot to organize the information. This data includes only single-digit numbers and the highest number is six. Because the answer is explained and illustrated at the bottom, project this...
Penguin Books
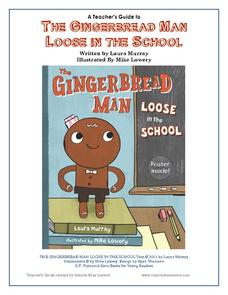
A Teacher's Guide to The Gingerbread Man Loose in the School
What if the Gingerbread Man was trying to catch you, rather than the other way around? Pupils can find out what happens by reading the story The Gingerbread Man Loose in the School by Laura Murray and enrich their experience with the...
Curated OER
Graphing the Annual Food Drive
Students graph the number of items contributed to the food drive. They compare daily results to other days or to an overall goal and answer questions based on the graph.
Illustrative Mathematics
Bank Account Balance
Represent the ups and downs of a bank account. The two-part task points out that some types of graphs may better show discrete functions than others. Pupils analyze a graph on how well it represents the situation. They develop their own...
Curated OER
How Much Folate?
This task includes scaffolding to support the introduction of the writing and graphing of linear inequalities. Then your geometry learners discover that writing down all possible combinations is not feasible so they are led to use...
Illustrative Mathematics
Puzzle Times
Give your mathematicians this set of data and have them create a dot plot, then find mean and median. They are asked to question the values of the mean and median and decide why they are not equal. Have learners write their answers or...
Curated OER
Fast Food Survey Using Bar Graphs
Second graders create a bar graph to pictorically represent the data collected from a survey of students. They use Excel to electronically create the graphs and data tallies. They then interpret their data using sentences to explain.
Illustrative Mathematics
Chocolate Bar Sales
In this real-world example, algebra learners start to get a sense of how to represent the relationship between two variables in different ways. They start by looking at a partial table of values that define a linear relationship. They...
Curated OER
How Many More on a Graph?
First graders identify a number that is one more or one less than a number up to one hundred and identify a mystery number. They also create a class graph that illustrates how many children are in each family, and answer questions about...
Illustrative Mathematics
Identifying Quadratic Functions
Put your high schoolers to the test and see how well they know their quadratic functions. With excellent thought-provoking questions, learners use what they know about creating quadratic equations based off different pieces of...
Curated OER
Let's Create a Collage!
Students create a collage and identify the various styles of artists and illustrators. They read Alphabet Adventure by Audrey Wood, illustrated by Bruce Wood and discuss his illustrations portrayed in the book. Students also create a...
Curated OER
Charting and Graphing Sales
Students analyze graphs, charts and tables. In this data analysis lesson, students practice creating and analyzing charts, graphs and tables corresponding to sales and surveys. This lesson uses data relevant to students and includes...
Curated OER
Graphing Memories
Mem Fox’s Wilfrid Gordon McDonald Partridge provides the labels for a graphing activity. Class members create an illustration of a memory item brought from home, and place their illustration in the proper column of a graph. When the...
Illustrative Mathematics
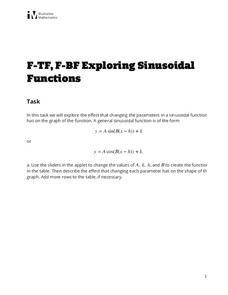
Exploring Sinusoidal Functions
What effect does changing a parameter have on the graph of a trigonometric function? Pupils use a Desmos applet to explore the general sine graph. They experiment changing different parameters and record the resulting change of the...
Illustrative Mathematics
Foxes and Rabbits 2
The fox population chases the rabbit population. Groups model the populations of foxes and rabbits with two trigonometric functions. Individuals graph both trigonometric models on the same graph, and then teams determine an explanation...
Curated OER
Birds' Eggs
More than just data, scatter plots are full of information that can be used to answer a variety of questions. This lesson uses a plot with information about bird egg sizes to answer questions about the relationship between length and...
EngageNY
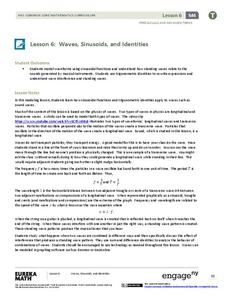
Waves, Sinusoids, and Identities
What is the net effect when two waves interfere with each other? The lesson plan answers this question by helping the class visualize waves through graphing. Pupils graph individual waves and determine the effect of the interference...
Concord Consortium
Shooting Arrows through a Hoop
The slope makes a difference. Given an equation of a circle and point, scholars determine the relationship of the slope of a line through the point and the number of intersections with the circle. After graphing the relationship, pupils...
Teach Engineering
Processes on Complex Networks
Introduces your class to random processes in networks with an activity that uses information about disease spread using the susceptible, infectious, resistant (SIR) model. Participants determine whether a susceptible person becomes...


