Curriculum Corner
Data Binders
Here is a great resource to support students you have identified early on as needing behavioral or general learning support, particularly if you are practicing a Response to Intervention (RTI) approach. This data binder printable allows...
NOAA
The Oceanographic Yo-yo
How does chemistry help deep-sea explorers? Part four of a five-part series of lessons from aboard the Okeanos Explorer introduces middle school scientists to technologies used in ocean exploration. Groups work together to analyze data...
Curated OER
What's Your Average? What Do You Mean? I'm More Than Just Average
Upper grade and middle schoolers collect data, analyze and interpret the data. This three-part lesson should provide learners with a firm understanding about the differences between mean, median, and mode and how to perform the...
Curated OER
Physical Science: Festival of Bubbles
Investigate bubbles through the use of scientific inquiry. Pupils blow bubbles using several methods and measure the resulting bubble print. Measurements are recorded on a data table and transferred to a bar graph. Results are discussed...
Curated OER
Getting the Lead Out
The article for this lesson no longer accessible through the links in the lesson plan, but can be found in the National Center for Biotechnology Information website. After reading it, environmental science students answer questions and...
Curated OER
Analyzing Discrete and Continuous Data in a Spreadsheet
You are what you eat! Your statisticians keep a log of what they eat from anywhere between a day to more than a week, keeping track of a variety of nutritional information using a spreadsheet. After analyzing their own data, individuals...
Curated OER
First Grade Shoe Sizes
Third graders collect shoe size data from classmates in their room and another third grade. They predict what the most common shoe size will be. They place the data in an spreadsheet on the computer. They design a graph using the...
Curated OER
The Hot Dog Stand - An Annual Report
Students run a computer simulation and collect data as they work and use the data to create an annual report for their business. It is desirable for students to do this project individually, but it could be done as a class using a large...
It's About Time
Factors Affecting Population Size
How do we predict future population growth? Young researchers investigate various factors affecting the size of our population. As they calculate and interpret graphs to determine factors that could potentially affect increases and...
Curated OER
Hands on Habitat
Students teach others about habitats. In this Science lesson, students use a Science Log to record data about a habitat for research. Students analyze the data and construct an eco-chamber. Students share what they have found with other...
Curated OER
CSI Interdisciplinary Projects
Work across content areas with an engaging project that highlights higher-level thinking, teamwork, and a STEM focus.
NASA
Exploration of a Problem: Making Sense of the Elements
When given too much data to simply memorize, it helps to sort it into manageable groups. The second lesson in the six-part series of Cosmic Chemistry challenges groups of pupils to take a large amount of data and figure out how to best...
Curated OER
Sports Teams & Math
Learners collect sports data, keep track of wiins, losses and scores and average the teams' scores.
Curated OER
Just Me and My Shadow
Learners take measurements throughout the day using a simple sundial called a gnomon. They record the results on a Data Log and convert from English units to metric (S.I.) units. Data points are plotted on the same graph and analyzed.
Curated OER
Weather
Students create a spreadsheet and chart using data collected. In this weather lesson, students select five cities from their state, including the city they live in. Students take daily temperature readings from all five cities. ...
McAuliffe-Shepard Discovery Center
Global Warming in a Jar
This well-organized lab activity introduces earth science pupils to the greenhouse effect. They will set up two experiments to monitor temperatures in an open jar, a closed jar, and a closed jar containing water. Ideally, you would have...
Curated OER
Conducting and Analyzing Local Studies
Pupils carry out the class weather study: recording, organizing and discussing data daily and keeping track of this work in their journals. They look for patterns and relationships in data, link these with what they know and with...
Curated OER
Graphing Activity
In this probability and statistics worksheet, students work with a family member to construct graphs based on real life data. The two page worksheet contains three questions. Answers are not included.
NOAA
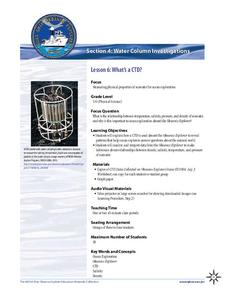
What's a CTD?
Why are the properties of the water important when exploring the ocean? Young scientists discover the tools and technology used in deep sea exploration in the fourth installment in a five-part series. Groups work together to examine...
Museum of Science
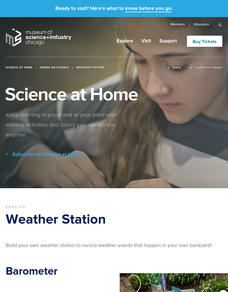
Weather Station
Find out what it is like outside before braving the elements. Teachers follow directions to build a barometer, rain gauge, and anemometer. Class members use the built weather instruments along with a thermometer to record weather...
Curated OER
First Class First? Using Data to Explore the Tragedy of the Titanic
Students analyze and interpret data related to the crew and passengers of the Titanic. They draw conclusions to better explain the people who were lost or saved as a result of the disaster, and whether or not social status affected the...
University of Georgia
Splat!
What does viscosity have to do with splatter? An activity shows that the viscosity of a substance is inversely proportional to the distance of its splatter. Learners conduct the experiment by collecting data, graphing, and analyzing the...
Howard Hughes Medical Institute
Survival of the Fittest - Variations in the Clam Species Clamys sweetus
It's not often that you come across a clever laboratory activity that is both imaginative and comprehensive! Using M&M's and Reese's peanut butter candies to represent two different clam species, young biologists test for "relative...
Curated OER
Log Book Guidelines
Students are given the guidelines for their log books. The log book first starts with what is the purpose of a log book. Then students have the instructions on how to organize a log book. From there student are given step by step...


