Curated OER
Graphing Linear Equations Using Data Tables
Students review the Cartesian plane and the process of plotting points. In groups, students create tables, identify the slope and y-intercept, and graph the equation. Afterward, students perform the same process, only, individually. As a...
Curated OER
Plotting the Ocean Floor
Fourth graders plot points on a graph, connect the dots to make the ocean floor profile and label the topographical features. They utilize a worksheet and a website imbedded in this plan to plot the ocean floor.
Curated OER
Measures of Central Tendency
In this measures of central tendency worksheet, students find the mean, mode and range of given sets of data. They interpret box-and-whisker graphs and stem-and-leaf plots. This two-page worksheet contains eleven multi-step problems.
Curated OER
Are Yellow, Green, Or Red Apples Your Favorite To Eat?-- Class Bar Graph
In this math worksheet, learners collaborate to complete a bar graph about favorite apples. Students plot the information from their class on a simple bar graph.
Curated OER
What Do You Like on Top of Your Pizza Most? --class Bar Graph
In this math worksheet, students participate in completing a bar graph as a class. Students survey classmates as to their favorite pizza toppings and plot the results on this bar graph.
Curated OER
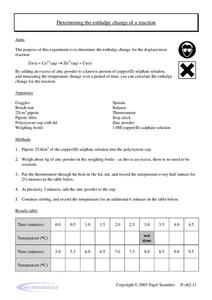
Determining the Enthalpy Change of a Reaction
For this enthalpy of reactions worksheet, students use a known amount of copper (II) sulphate solution and an excess of zinc powder to calculate the enthalpy change of the reaction. Students measure the temperature change over the course...
Curated OER
The Nucleus-Radioactivity
In this nucleus and radioactivity worksheet, high schoolers collect class data and the students represent radioactive atoms decaying. They plot their data and answer two questions about the results. They solve seven problems given the...
Curated OER
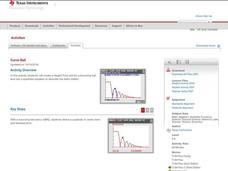
Curve Ball
Learners explore the concept of parabolas by collecting quadratic data on a bouncing ball as it is falling using a motion detector. They plot the data and determine the equation of the quadratic in vertex form, then determine the values...
Curated OER
The Human Population
In this human population worksheet, students are given data about the size of the human population from the 1800s to 1999. They plot the data and answer critical thinking questions about the changes in human population.
Curated OER
Magnetic Storms
In this magnetic storms worksheet, students use a graph of data collected over time showing the magnitude of a magnetic storm. Students use the data to solve 6 problems about the graph and they determine the strength of the storm at...
Curated OER
Super Bowl Champs
In this Super Bowl instructional activity, students create line plots of all winners and losers of the Super Bowl. They create stem-and-leaf plots, scatter plots, and bar graphs of football data. This one-page instructional activity...
Curated OER
Asteroids Between Mars and the Sun
In this asteroids of the solar system worksheet, students observe a diagram showing all the minor planets found in the orbit of Mars. Students answer 4 questions about the minor planets inside the orbit of other planets, they find the...
Curated OER
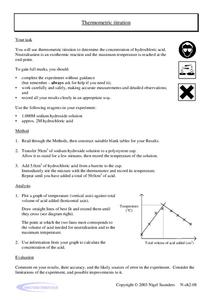
Thermometric Titration
In this thermometric titration worksheet, students titrate hydrochloric acid with sodium hydroxide to determine the concentration of hydrochloric acid. They measure the change in temperature of the solution, plot their data and use the...
Curated OER
The Reaction Between Magnesium and Hydrochloric Acid
In this rate of chemical reactions learning exercise, students experiment with different concentrations and volumes of hydrochloric acid mixed with magnesium. They measure the rates of the reactions and analyze their results from a graph...
Curated OER
Satellite Technology
In this satellite technology worksheet, students read about Low Earth Orbit satellites and the frictional drag from the Earth's atmosphere that causes them to fall back towards the Earth. Students use given data of the years the...
Curated OER
Geometric Sequences and Series
Learners find common ratios of geometric sequences on a spreadsheet. Using this data, they create scatter plots of the sequences to determine how each curve is related to the value of the common ratio. They will consider whether series...
Curated OER
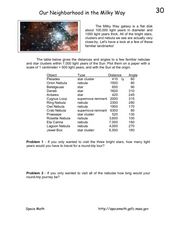
Our Neighborhood in the Milky Way
For this Milky Way galaxy worksheet, students are given a table of distances and angles of nebulae and star clusters from the sun. Students plot each one on a piece of paper and solve 2 problems using the data.
Curated OER
Cities
Students examine U.S. Census figures. In this urban centers activity, students compare city populations across the span of 50 years. Students create line graphs based on the data.
Curated OER
Areas Under Curves: An Astronomical Perspective
In this area under the curve worksheet, students use a graph of the number of exoplanets discovered and the year they were discovered to solve 5 problems. Students find the total area under the curve, they find the total number of...
Curated OER
Stem-and-Leaf Plots
Students are introduced to stem-and-leaf plots and calculating the mean, median, and mode from the plots.
Curated OER
Statistics
In this statistics activity, students solve and complete 2 different problems that include using statistics. First, they use the scatterplot shown to determine the value of x that best matches the expression. Then, students determine the...
National Park Service
Fire Ecology on the Rim
An engaging unit on wildfires includes three sections, including a background section with eight lessons and five activities, a field experience section with 13 lessons and five activities, and a conclusion section featuring an analysis...
Science 4 Inquiry
Deforestation
Young scientists observe deforestation from satellite photos and discuss the importance of forests to the global environment. They then simulate a plot of forest when farmers move into the area over the course of seven years. Finally,...
Curated OER
Estimating the Mean State Area
Seventh grade statisticians randomly select five states and then determine the mean area. The class then works together to create a dot plot of their results.


