Curated OER
Data Squares
Middle and high schoolers examine how data squares organize and sort information and data sets. They discuss examples of data squares, complete a data square about themselves, organize the data squares for the class together, and compile...
Curated OER
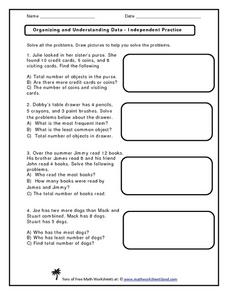
Organizing and Understanding Data - Independent Practice
Provide your first graders with an opportunity for independent practice organizing and understanding data. The ten story prompts on this three-page activity asks learners to solve problems involving concepts of the total number of...
EngageNY
Distributions and Their Shapes
What can we find out about the data from the way it is shaped? Looking at displays that are familiar from previous grades, the class forms meaningful conjectures based upon the context of the data. The introductory lesson to descriptive...
Math Mammoth
Decimal Problems
In this math worksheet, students are given tables and story problems with decimal points. Students must use the tables and story problems to find 10 answers about the data.
Curated OER
Digger and the Gang
Help online friends Digger and Sprat from the BBC series to solve math problems! In a series of activities, your class will use data sets to calculate measurements, averages, means, and probabilities. The class completes worksheets and...
Curated OER
Kevin's Camp Schedule
In this elapsed time learning exercise, students study a camp schedule of activities. Students solve 5 story problems using the information in the table.
Curated OER
The Gathering and Analysis of Data
Young mathematicians gather data on a topic, graph it in various forms, interpret the information, and write a summary of the data. They present their data and graphs to the class.
Curated OER
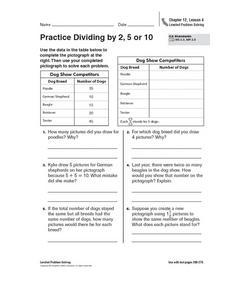
Practice Dividing by 2, 5, or 10
In this pictograph problem solving worksheet, students analyze the data on a table and create a pictograph. Students read and solve 6 story problems about the pictograph.
Curated OER
Guess My Rule: Diversity of Learners Adaptation
Learners write equations if they change the data of the population to find patterns. They look for patterns in the data regarding male to female ratio (using the lowest possible). Students write a short story for the data that changes...
Public Schools of North Carolina
Math Stars: A Problem-Solving Newsletter Grade 5
Looking for a way to challenge the problem-solving abilities of your young mathematicians? Then look no further. This collect of newsletter worksheets engages learners with a variety of interesting word problems that cover topics ranging...
Curated OER
My Test Book: Story Problems
In this math skills practice instructional activity, students solve 10 multiple choice math problems that require them to respond to story problems.
Curated OER
Tenths
In this fractions and decimals worksheet, students analyze a data table about painting playground fence posts. Students solve 6 story problems in which a fraction and a decimal are converted.
Savvas Learning
Saxon Math 5/4
You'll never have to search for another worksheet again after downloading this extensive collection of Saxon math materials. With over 600 pages of example problems and skills practice exercises, this is a must-have resource for any...
Curated OER
Energy Conservation
Students investigate energy conservation. In this energy conservation and analyzing data lesson plan, students identify and explain several energy sources and research renewable and nonrenewable energy sources. Students use statistics...
Curated OER
Word Problems: "Leaving D.C."
In this solving math story problems instructional activity, students read statistics from the Student edition of USA Today to solve word problems. Students solve 6 problems.
Curated OER
Hopes and Dreams: A Spreadsheet Lesson Using Excel
Fourth graders read "The Far Away Drawer" by Harriet Diller and discuss the story as a class. After discussion, 4th graders create a t-shirt GLYPH about their hopes and dreams,share their information with the class and create spreadsheets.
Curated OER
Power Metering Project
Students collect and analyze variable data and understand the concept of electrical power. In this energy lesson students use a spreadsheet to manage their data and create box plots.
Curated OER
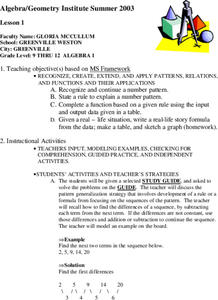
Patterns, Relations, and Functions
Learners investigate the patterns of different data sets of numbers. They use critical thinking skills in order to find the missing numbers in any given set. This instructional activity helps to develop the skill of number sense.
Curated OER
Interpreting Graphs
Sixth graders interpret linear and nonlinear graphs. They create graphs based on a problem set. Next, they represent quantitive relationships on a graph and write a story related to graphing.
Curated OER
Lines of Fit
Students graph an equation and analyze the data. In this algebra lesson, students graph scatter plots and identify the line of best fit using positive correlation, negative correlation an d no correlation. They apply their data analysis...
Curated OER
Graphing Pockets
Second graders explore graphing. They count the number of pockets on their clothes and use Microsoft Excel to enter their data. Students create a class graph displaying their findings.
Inside Mathematics
Vencent's Graphs
I like algebra, but graphing is where I draw the line! Worksheet includes three multiple-part questions on interpreting and drawing line graphs. It focuses on the abstract where neither axis has numbers written in, though both are...
Curated OER
Making A Table
Sixth graders explore creating tables as a way to organize data. Students read story problems and discuss methods and strategies to solve them. They practice drawing tables, spotting patterns, and identifying missing information.
Curated OER
Who Dirtied The Water/Clean Water: Is It Drinkable?
Students enter the room, receive a film canister that contains materials that be added to the dirty water bell jar. They record on their data table who or what is doing the adding and the actual substance that has been added to the bell...


