Curated OER
Building Brilliant Bar Graphs
Everything you need for a mini-unit on bar graphs is included in this lesson plan! It outlines three lessons and includes worksheets. Learners taste pretzels, shoot baskets (switching off hands), and grab candy, graphing results...
Curated OER
Great Graph!
Here is a fantastic lesson counting coins, interpreting graphs, and the concept of "greater than" and "less than." Young mathematicians utilize worksheets embedded in the plan in order to practice these concepts. The worksheets are...
Illustrative Mathematics
Weather Graph Data
Teaching young mathematicians about collecting and analyzing data allows for a variety of fun and engaging activities. Here, children observe the weather every day for a month, recording their observations in the form of a bar graph....
Kenan Fellows
Using Motion Sensors to Explore Graph Sketching
Get moving to a better understanding of graphs of derivatives. Using motion sensors, scholars vary their velocities to create graphs of the first derivative of a function. The activity challenges groups to first create a script of the...
Charleston School District
Graphs of Linear Functions
What does a slope of 2/3 mean? Develop an understanding of the key features of a linear function. Pupils graph the linear functions and explain the meaning of the slope and intercepts of the graphs.
West Contra Costa Unified School District
Using Derivatives to Graph Polynomials
You can learn to graph as well as a calculator using calculus. The lesson introduces using derivatives to find critical points needed to graph polynomials. Pupils learn to find local maximums and minimums and intervals of increase and...
Virginia Department of Education
Solving and Graphing Inequalities
You can't go wrong with a lesson that involves candy! Learners solve and graph one-variable inequalities and use candy to graph the solution. Individuals associate open circle graphs with life savers and closed circle graphs with round...
EngageNY
Basic Trigonometric Identities from Graphs
Have young mathematicians create new identities! They explore the even/odd, cofunction, and periodicity identities through an analysis of tables and graph. Next, learners discover the relationships while strengthening their understanding...
CPALMS
Writing an Exponential Function from its Graph
Grow an equation for the exponential graph. Given a graph of an exponential function, class members write the equation of the function provided. The graph labels two points on the graph: the y-intercept and the point where x is one.
EngageNY
Analyzing a Graph
Collaborative groups utilize their knowledge of parent functions and transformations to determine the equations associated with graphs. The graph is then related to the scenario it represents.
CK-12 Foundation
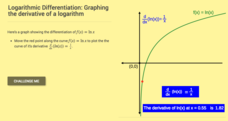
Logarithmic Differentiation: Graphing the Derivative of a Logarithm
Log the values of the derivative of a logarithm. The interactive plots the derivative of the natural logarithm. Learners first determine the derivative of natural logarithm and the general logarithm. Using the formulas for the...
Curated OER
Differential Equations
In this differential equations worksheet, students solve and complete 3 different parts of a problem. First, they sketch a slope field for the given differential equation on the axes provided. Then, students write an equation for the...
National Security Agency
Going Green with Graphs
In this unit designed for second graders, youngsters are introduced to conducting surveys and creating tally charts based on the data they gather. Students then construct bar graphs, and observe the relationships between the two types of...
EngageNY
The Graph of the Natural Logarithm Function
If two is company and three's a crowd, then what's e? Scholars observe how changes in the base affect the graph of a logarithmic function. They then graph the natural logarithm function and learn that all logarithmic functions can be...
NASA
Geographical Influences
"If global warming is real, why is it so cold?" Distinguishing the difference between weather and climate is important when it comes to understanding our planet. In these activities, young scientists look at the climate patterns in a...
Pace University
Grade 7 Earth Day Statistics with Circle and Bar Graphs
Take a tiered approach to studying waste. The lesson uses Earth Day to present differentiated instruction around using circle and bar graphs. Each group gets a cube based on their tiers and works collaboratively as well as individually...
Curated OER
Regents High School Examination: Living Environment 2007
Environmental science enthusiasts show what they know at the end of the year by taking this full-fledged final exam. They answer multiple choice, graph interpretation, and essay analysys questions, 73 of them in all. Topics range from...
David Pleacher
Candy Math Fun
Few things can motivate children to learn like the promise of a sweet and tasty treat. Given a bag of M&M®s, Skittles®, or other colorful candy, students first predict the contents of the bag before counting the pieces, creating a...
Radford University
Transformational Graphing in the Real World: Building Bridges
No suspension here, the resource is good to go. Using graphing calculators, scholars explore how transformations affect the graphs of quadratic functions. They consider how the changes relate to the context of suspension bridges.
Flipped Math
Calculus AB/BC Unit 5 Review: Analytical Applications of Differentiation
Time to put it all together in one sheet—well five. Pupils review all the topics presented in the resources for Analytical Applications of Differentiation. The five pages summarize the concepts with explanations and examples.
Curated OER
Differentiation
Learners explore estimated and exact results for derivatives, tangent lines, implicit differentiation, and symbolic differentiation. The lesson provides examples with solutions and practice problems.
Curated OER
Implicit Differentiation
Pupils explore the concept of derivatives. They use implicit differentiation to determine points on a graph where a tangent line is horizontal, vertical, or oblique. Finally, learners find the derivative of a polynomial by...
Curated OER
Further Differentiation
In this further differentiation instructional activity, students solve and complete 7 various types of problems. First, they sketch the graph of each equation using a stationary point. Then, students find the stationary points of each...
Texas Instruments
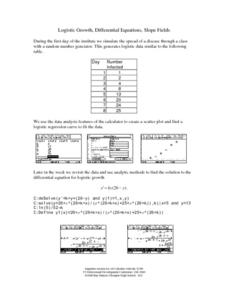
Logistic Growth, Differential Equations, Slope Fields
Investigate differential equations with your class. They use the TI-89 to explore differential equations analytically, graphically, and numerically as the examine the relationships between each of the three approaches.


