Curated OER
Algebra: Coordinates and Straight Line Graphs
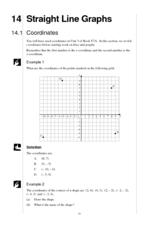
Young mathematicians review what they have previously learned about coordinates and straight line graphs. Then, they access an interactive component within the lesson to gain more practice with this skill. Additionally, there are two...
Curated OER
Straight Line Graphs
In this line graphs worksheet, students draw lines for 9 problems then solve 9 additional problems relating to line graphs. Answers are included.
Computer Science Unplugged
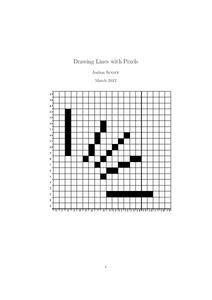
Drawing Lines with Pixels
How do the computers keep it straight? Using the provided algorithms, class members draw a line and a circle using pixels. They then check the drawings using a straight edge and compass to determine the accuracy of their drawings.
Inside Mathematics
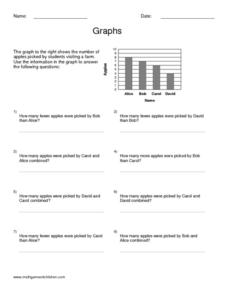
Graphs (2006)
When told to describe a line, do your pupils list its color, length, and which side is high or low? Use a instructional activity that engages scholars to properly label line graphs. It then requests two applied reasoning answers.
Curated OER
Line and Double Line Graphs: Reteach
In this graphing worksheet, students review the five steps for making a double line graph to display data. Students then use the graph they made following the shapes to answer the three questions.
Curated OER
Straight Line Graphs
Students discover certain equations produce straight lines. In this graphing lesson, students draw axis and problem solve to find coordinates to graph.
Concord Consortium
Line of Sight
There's no way around it—learners must use trigonometry to model the line of sight around a race track! Using the starting line as the origin, pupils model the straight line distance to any car using a trigonometric expression. The...
EngageNY
Informally Fitting a Line
Discover how trend lines can be useful in understanding relationships between variables with a lesson that covers how to informally fit a trend line to model a relationship given in a scatter plot. Scholars use the trend line to make...
American Statistical Association
You and Michael
Investigate the relationship between height and arm span. Young statisticians measure the heights and arm spans of each class member and create a scatter plot using the data. They draw a line of best fit and use its slope to explain the...
West Contra Costa Unified School District
Correlation and Line of Best Fit
Computers are useful for more than just surfing the Internet. Pupils first investigate scatter plots and estimate correlation coefficients. Next, they use Microsoft Excel to create scatter plots and determine correlation coefficients and...
Curated OER
Animal Brains
Do big bodies make big brains? Let your learners decide whether there is an association between body weight and brain weight by putting the data from different animals into a scatterplot. They can remove any outliers and then make a line...
Curated OER
Walking the Plank
This is a cool math activity. Kids collect and interpret data based on a physical act. A board is balanced between a scale and a step, learners record a peer's weight as it decreases while s/he walks further away from the scale. They...
Curated OER
Comparing Data on Graph A and Graph B
Second graders gather and graph data. In this graphing lesson, 2nd graders collect data and graph this information using tally charts, bar graphs, pictographs, or tables. They make predictions about the outcomes.
Curated OER
Graphs
In this algebra instructional activity, students calculate the point of intersection between a circle and a straight line. There are 5 questions with an answer key.
Curated OER
Graphing Equivalent Fractions
Students graph families of equivalent fractions and compare them by observing the slope of the line formed by each fraction family. They place fractions in ascending order by comparing the slopes of each line after several families of...
Mathed Up!
Inequalities Regions
Discover how to solve systems of inequalities by graphing. An informative video shows pupils how to determine the solution set after graphing each inequality of a system. To finish, a worksheet gives them a chance to practice this skill.
Curated OER
Unit VII Energy: WS 1 Qualitative Analysis - Pie Charts
For each of eight diagrams of objects in motion, physics masters draw pie charts to depict the changes in energy. For each they must identify the energy conditions at each position. This is a unique worksheet, perfect for assessing how...
Virginia Department of Education
May I Have Fries with That?
Not all pie graphs are about pies. The class conducts a survey on favorite fast food categories in a lesson on data representation. Pupils use the results to create a circle graph.
Exploratorium
Traveling Networks
Show your class the path to understanding graph theory. Scholars learn about basic graph theory using an activity based on the Bridges of Konigberg problem. They draw networks on the playground and decide whether it is possible to travel...
Curated OER
Problem Solving: Graphing Functions
In this graphing functions worksheet, students solve 6 word problems, finding ordered pairs, missing coordinates and numbers, slopes of lines and functions.
Curated OER
Constructing Parallel Lines
Students construct parallel lines using a protractor and a straightedge. In this geometry lesson, students identify the properties of parallel lines. They use Cabri to graph and observe the lines.
Curated OER
Scientists Track the Rising Tide
In this tracking the rising tide activity, learners use the data in a graph showing the seal level change versus time from 1900 to 2000 to answer 3 questions about the rising tides. Students determine the slope of a line drawn from 1920...
Curated OER
Worksheet Gr4: Linear Equations
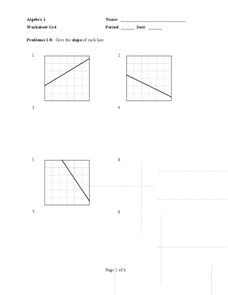
In this linear equations worksheet, students solve 24 short answer problems about slope. Students find the slope of a line given a table, graph, two points, and the intercepts.
Curated OER
Straight Graph Lines: Coordinates
Students access prior knowledge of coordinates. In this coordinates lesson, students graph coordinate points to create a symmetrical figure and of a straight line. Students complete several practice examples.


