Education World
Back-to-School Survey
From their strengths and challenges in the classroom, to favorite television shows and genres of books, discover more about your class members in order to enhance your instruction and build stronger relationships throughout the school year.
Brigham Young University
Harry Potter And The Chamber of Secrets: Reading Attitude Survey
Use this attitude survey to find out how your class members feel about reading. You can then analyze the responses, and design a unit study of Rowling's novel based on these attitudes.
Curated OER
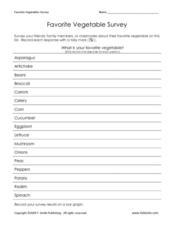
Favorite Vegetable Survey
What's your favorite? Use this chart template in your lesson on data collection and graphing. Learners record classmates' favorite vegetable in a survey, and then graph the results. A labelled graph is provided here- print both pages...
Curated OER
Survey Says...
Young statisticians collect, organize, and present data to illustrate responses to a survey question. They write and conduct the survey. They finish by presenting the results in the form of a graph.
Illustrative Mathematics
Favorite Ice Cream Flavor
What better way to engage children in a math instructional activity than by talking about ice cream? Using a pocket chart or piece of chart paper, the class works together creating a bar graph of the their favorite ice cream flavors....
Curated OER
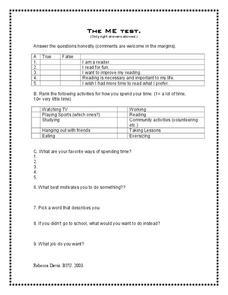
The Lion, the Witch and the Wardrobe: Me Test
Get to know your scholars with this in-depth survey that asks learners to rate, answer true or false, write short answers, and draw abstract visuals about their academic and personal preferences.
Curated OER
Survey Says...
Young learners create and implement a school-wide survey about student body favorites! Learners record and analyze the data on a bar graph, picture graph, and line graph, and then display the data. Then, wrap it all up with a celebration...
Curated OER
What's Your Favorite Food?
Advanced beginner to intermediate ESL level learners, use English to communicate in social settings by conducting a survey. They ask questions to develop new vocabulary and build communication skills.
Curated OER
Students' Favorite Reading Topics
Students complete surveys about their favorite reading topics to determine the kinds of books to purchase for the school library.
Curated OER
Favorite Food
Students are given three choices of food. They then decide on their favorite and predict what the class's favorite food will be. After the teacher enters the data into the computer, students gather around the computer to view the...
abcteach
What is Your Favorite Month?
A simple worksheet that helps learners conduct a survey is here for you. In it, pupils collect data on their family and classmate's favorite months. Youngsters use tally marks in the spaces provided to keep track of the answers. Once...
Curated OER
Graphing Favorite Holidays
In this graphing worksheet, students survey their classmates and record favorite holidays. There are 8 choices of holidays listed and the numerical intervals of 2.
Math Worksheets Land
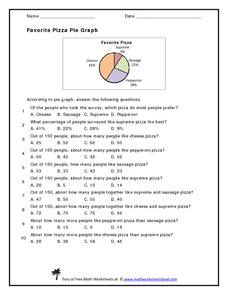
Favorite Pizza Pie Graph
You've heard of a pie graph, but what about a pizza pie graph? Challenge young mathematicians to answer ten questions based on a random survey of people's favorite pizzas. A pie graph displays the percentages of each type of pizza. Some...
Math Worksheets Land
My Favorite Animal At The Zoo Pie Graph
What is your favorite animal at the zoo? Young mathematicians answer eight multiple choice questions, based on a survey of 50 people presented in a pie graph. Additionally, the graph does not display any numbers, but rather different...
Have Fun Teaching
All About Me
Get to know all about your new class with this simple back-to-school survey. Focusing on basic background information as well as interests, experiences, and aspirations, this resource is a a great tool for beginning to build...
Curated OER
TV Survey - Data Collection and Analysis
In this data collection and analysis activity, 4th graders complete a tally chart about the number of hours that fourth graders watch television. They create a bar graph with the information, write a paragraph about the survey results,...
Curated OER
Who is your favorite character from Charlotte’s Web?
In this Charlotte's Web worksheet, students utilize a form with tally marks to gather information on people's favorite characters from the novel Charlotte's Web and then graph out their results.
Curated OER
Our Favorites
Students participate in and conduct a survey to determine various class favorites. They collect, organize and display their data, interpret the results, and complete a packet of worksheets to display the information.
Curated OER
A World of Favorites
Investigate pupils' favorites worldwide by having them create and publish a questionnaire to gather information about students' favorites. They will conduct research about a continent, create three web pages and a chart representing the...
Curated OER
My Favorite Things
In this survey of favorite things worksheet, students complete the sentences with their personal favorite things. Students write seven short answers.
Curated OER
Favorite Fairy Tales
In this favorites survey worksheet, students poll their classmates, teachers, parents, and friends about people's favorite fairy tales. Students complete the chart with the information.
Curated OER
Favorite Restaurants
Pupils conduct a survey on their classmates favorite restaurants. They use the information they collected and compile it into a database. They share their findings with the school.
Curated OER
Graphing Your Favorite Pizza Topping
Fifth graders can survey the students just in their classroom, the grade level, or other grade levels. Upon finishing the surveys and compiling the data, the students can input their results in an Excel template or create their own...
Curated OER
Students Favorites
Students complete activities using a frequency table and construct a pie graph for the data. In this frequency table lesson, students complete a survey to find data for a frequency table. Students use the given link to make a pie graph...


