Curated OER
How to Graph in Excel
Fourth graders construct data graphs on the Microsoft Excel program. In this statistics lesson, 4th graders formulate questions and collect data. Students represent their results by using Excel.
Curated OER
Beginning Graphs in MS Excel
Students practice creating graphs in Microsoft Excel. In this technology lesson, students conduct a random survey and collect data. Students use the Microsoft Excel program to create a bar graph of the data.
Curated OER
Excel for Beginners
For this Excel lesson, students set a formula to check their homework. Students also use clipart, work in groups, and learn to use the tools in the drop-down list.
Curated OER
Excel Turns Data Into Information
Students use excel to analyze data. In this technology instructional activity, students enter data into the excel program to find averages and organize data.
Curated OER
Data! Data! Graph that Data!
Fifth graders create data graphs using Microsoft Excel. In this data collection lesson, 5th graders create and conduct a survey, then use Excel to organize and graph their data.
Curated OER
Hygiene Potato Graphs
Fifth graders discuss the importance of proper hygiene. After watching their teacher peel potatoes, they discuss why she was wearing rubber gloves. They demonstrate how to wash their hands properly and why one should never touch...
Curated OER
Generate Measurement Data Word Problems
Bar and line graphs are an excellent way to visually analyze data: give your scholars practice both analyzing graphs and creating their own! First, they examine five basic bar graphs, indicating the number of squares on specific days....
Curated OER
Graphing on the Computer
Students create a bar graph on the computer using given information from the teacher. They create a bar graph using their own information chart (they need to create one on separate paper first). They utilize Microsoft Excel for this...
Curated OER
Building Arrays Using Excel Spreadsheets
Students create arrays using Microsoft Excel. In this technology-based math lesson, students expand their knowledge of multiplication by creating arrays on the computer using a spreadsheet program such as Microsoft Excel.
Curated OER
Are You My Little Peanut?
Fourth graders explore the mass and length of peanuts by pretending to parent a peanut. In this mode, median and range lesson students graph their measurements and then use them to find the mode, median and range. Students discuss peanut...
Curated OER
Math Vocabulary Words
In this math vocabulary worksheet, students read 14 math vocabulary words relating to statistics and graphs. This would be an excellent tool for teachers to create a math vocabulary word wall. Teachers could use these labels and...
Teach Engineering
Applying Statistics to Nano-Circuit Dimensions in Fabrication
Do flexible circuits change dimensions during fabrication? Groups use GeoGebra software to measure the length of pictures of flexible nano-circuits. To determine if the circuits change dimensions, future engineers use Microsoft Excel to...
Council for Economic Education
Production Possibilities Curve
Demonstrate the important economic principles of the production possibilities curve, including how to calculate opportunity cost and graph curves by using a table or calculation. Learners use a variety of methods, including videos,...
Cornell University
Sound Off!
Time to witness the effects of sound. Learners analyze different materials to determine their abilities to absorb sound waves. They use free software to monitor the amplitude of the waves to verify results.
Curated OER
Graphing and Demography: The Domestic Slave Trade
High schoolers create graphs or charts based on the data a narrative imbedded in this plan. They make them either by hand or by using Excel or a similar database program. This lesson plan utilizes technology in a meaningful way.
Curated OER
GSE Foundations of Algebra: Equations and Inequalities
Need lessons on writing and solving one- and two-step linear equations and inequalities, as well as systems of equations? This comprehensive 106-page module from the Georgia Department of Education contains many different lessons for a...
Curated OER
Science in Focus: Force and Motion
Learners explore force and motion through a series of experiments. In this physics lesson, students create and interpret speed graphs. They build an electromagnet and explain the factors affecting its strength.
Curated OER
Student Learning-Strengths Inventory
Pupils complete an online inventory to determine their strengths and weaknesses. They create graphs to show their results. They discover how they are unique from their classmates.
Curated OER
A Nation of Nations Lesson Plan: Charting African Ethnicities in America
Students read a portion of the narrative, The Transatlantic Slave Trade, to explain the ethnic origins of enslaved Africans brought to the US. They create charts and bar graphs comparing ethnicities in the lowlands and tidewater regions.
Curated OER
In Debt or Not In Debt
Young scholars investigate the use of credit cards. For this algebra lesson, students differentiate the interest rate of credit cards and how to stay debt free. They identify pros and cons of credit cards.
Curated OER
Sun Spot Analysis
Students use Excel to graph monthly mean Greenwich sunspot numbers from 1749 to 2004. They perform a spectral analysis of the data using the free software program "Spectra". Short answer and thought questions related to the graphical...
Curated OER
The Breathtaking Nature of the Urban Explosion, Part 2
Learners explore ozone levels. They measure the concentrations of ground-level ozone in the atmosphere. Students observe changes in the concentrations of ozone over time. Learners complete a data sheet to record ozone readings over a...
Curated OER
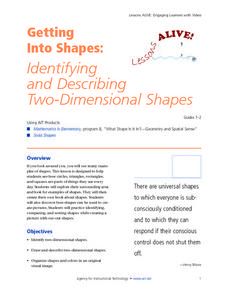
Getting Into Shapes: Identifying and Describing Two-Dimensional Shapes
Young scholars examine their classroom to find examples of various types of shapes. After identifying and describing the various shapes, they draw as many as they can on a piece of paper. They organize them into an image based on their...
Discovery Education
Sonar & Echolocation
A well-designed, comprehensive, and attractive slide show supports direct instruction on how sonar and echolocation work. Contained within the slides are links to interactive websites and instructions for using apps on a mobile device to...


