Curated OER
8.SP.1Texting and Grades I
Here is a fitting question for middle schoolers to consider: Is there a relationship between grade point average and frequency of sending texts? Starting statisticians examine a scatter plot and discuss any patterns seen.
Curated OER
Evaluating Transcripts
Ninth graders review their transcripts and calculate their individual grade point averages. They brainstorm on how they can keep track of their progress in school and what information will follow them throughout their lives. Each student...
Student Handouts
What's My GPA?
Here is an excellent, detailed one-page reference sheet to introduce students to what a grade point average (GPA) is and how to calculate their own.
EngageNY
The Mean as a Balance Point
It's a balancing act! Pupils balance pennies on a ruler to create a physical representation of a dot plot. The scholars then find the distances of the data points from the balance point, the mean.
CK-12 Foundation
Average and Instantaneous Rates of Change
How can you determine the rate of change on a curve? Pupils use the interactive to discover what happens with the average rate of change as the point move closer to the other. Using the definition of the derivative, learners find that it...
CCSS Math Activities
Smarter Balanced Sample Items: 8th Grade Math – Claim 4
A math model is a good model. A slide show presents 10 sample items on modeling and data analysis. Items from Smarter Balanced illustrate different ways that Claim 4 may be assessed on the 8th grade math assessment. The presentation is...
Curated OER
Fluency Passages, 3rd Grade
What would it be like to travel in a covered wagon? Learn about the life of a pioneer with a short informational reading passage. Kids read four paragraphs about traveling in a covered wagon and how it is different than traveling today,...
Curated OER
Texting and Grades II
Given the least squares regression line, interpret the slope and intercept in the context of the relationship between texting and GPA. Although this task is short and looks simple, some subtle points can be brought to light in a...
NASA
MASS, MASS – Who Has the MASS? Analyzing Tiny Samples
What is it worth to you? A hands-on lesson plan asks groups to collect weights of different combinations of coins and calculate weighted averages. They use the analysis to understand the concept of an isotope to finish the third lesson...
Novelinks
The Lightning Thief: Concept/Vocabulary Analysis
Before you begin reading Percy Jackson and the Lightning Thief by Rick Riordan, read over this comprehensive handout that gives you a plethora of information regarding the story's summary, organizational structure, central...
Curated OER
Points on a Line
Get your learners up and moving, all while reviewing numbers on the number line! For this activity, learners are grouped in teams outdoors. The teacher will have already created number lines on the ground (with chalk, tape, etc.), and...
Curated OER
Estimating the Mean State Area
Seventh grade statisticians randomly select five states and then determine the mean area. The class then works together to create a dot plot of their results.
EngageNY
Constant Rate
Two-variable equations can express a constant rate situation. The lesson presents several constant rate problems. Pupils use the stated constant rate to create a linear equation, find values in a table, and graph the points. The resource...
Curated OER
Averages
In this averages worksheet, students complete word problems where they find the average (sometimes called 'mean') of numbers. Students complete 10 multiple choice word problems.
Virginia Department of Education
Balancing Act
How many different interpretations of the mean are there? Scholars place numbers on a number line and determine the mean. They interpret the mean as the average value and as the balance point.
EngageNY
Mid-Module Assessment Task: Grade 8 Module 6
Make sure pupils have the skills to move on to the second half of the module with a mid-module assessment task. The formative assessment instrument checks student learning before moving on to the rest of the lessons in the unit.
Houghton Mifflin Harcourt
Unit 3 Math Vocabulary Cards (Grade 3)
Looking for math vocabulary cards for third graders? Use a set of 15 math cards with terms associated with graphing. The top half of each sheet has the vocabulary word printed in bold text, and the bottom half includes the word's...
US Environmental Protection Agency
Non-Point Source Pollution
Investigate the different types of pollution that storm drain runoff carries into oceans, lakes, rivers, and streams with this class demonstration. Using an aquarium and an assortment of everyday items that contaminants like motor oil,...
College Board
2016 AP® Environmental Science Free-Response Questions
The average student scores less than three points, out of five, on the AP Environmental Science test. Most do well on the multiple choice and struggle with the free-response section. Encourage extra free-response practice with actual...
EngageNY
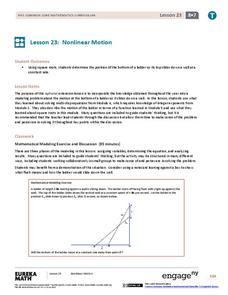
Nonlinear Motion
Investigate nonlinear motion through an analysis using the Pythagorean Theorem. Pupils combine their algebraic and geometric skills in the 24th lesson plan of this 25-part module. Using the Pythagorean Theorem, scholars collect data on...
CK-12 Foundation
Line Plots from Frequency Tables: Sleep Cycles
Demonstrate the ease of using a frequency table. An interactive lesson allows learners to create a frequency table efficiently. Challenge questions ask your classes to analyze the data represented in the frequency table.
Curated OER
Academic Vocabulary: Sports Challenge
This PowerPoint enables students to review mathematical terms in an interactive review game format. The slides contain a question about a mathematical term and the students must answer with the correct vocabulary word in order to get...
National Park Service
It's Not Easy Being Grizz
Grizzly bears can be up to 600 pounds and require a great deal of food, especially to survive hibernation. Comprised of multiple games, the third lesson of five only uses one setup. Pupils run around a large field, sorting and collecting...
Curated OER
Calculating Your GPA
Learners in grades 9-12 learn about their GPA. They learn what GPA stands for, how to calculate their own GPA and what it means for them in relation to their personal goals and for potential colleges.


