Flipped Math
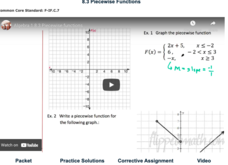
Piecewise Functions
Break it up into pieces to solve the problem. Individuals watch a video on how to graph and determine the equation and values of piecewise functions. Viewers then work several exercises to practice evaluating a piecewise function at...
Curated OER
Exponential Functions
Analyze functions by their shape and equation and identify decay and growth based on the equation given. Learners graph their exponential functions and differentiate it using the logarithmic versus the exponential function.
Flipped Math
Calculus AB/BC - Sketching Graphs of Functions and Their Derivatives
Find deeper meaning in graphs. Pupils use the knowledge gained from the previous sections in the unit to sketch graphs of a function's derivative. Learners also see how to sketch a graph of a function given the graph of its derivatives....
EngageNY
Graphing Rational Functions
Put everything together in a picture. Scholars take what they learned in the previous three lessons in the 15th segment of a 23-part unit to graph rational functions. They find the end behavior, the horizontal and vertical asymptotes if...
CK-12 Foundation
Input-Output Tables for Function Rules
How does changing a graph affect the function? Learners watch the changing input-output table as they adjust the location of the line graph. Questions prompt them to complete a table of values and determine the function rule.
Agile Mind
Transforming Graphs of Quadratic Functions
In the activity on this webpage, learners use interactive graphing technology to investigate transformations of graphs. In the first part of the task, they look at the graph of a quadratic function with coordinates of a few points...
Illustrative Mathematics
Transforming the graph of a function
This activity guides learners through an exploration of common transformations of the graph of a function. Given the graph of a function f(x), learners generate the graphs of f(x + c), f(x) + c, and cf(x) for specific values of c. The...
Illustrative Mathematics
Identifying Graphs of Functions
Match the graph with its function in an exercise that focuses on variations of the graph of y = e^x. Learners are given four graphs on the same set of axes and four functions, all involving e^x. The task is to match each function with...
EngageNY
Relationships Between Quantities and Reasoning with Equations and Their Graphs
Graphing all kinds of situations in one and two variables is the focus of this detailed unit of daily lessons, teaching notes, and assessments. Learners start with piece-wise functions and work their way through setting up and solving...
Curated OER
Worksheet 2: Graphs, Functions and Derivatives
In this math worksheet, learners answer 7 questions having to do with graphing derivatives of functions, rectilinear motion, speed and distance.
Curated OER
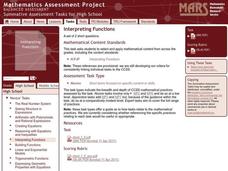
Interpreting Functions
Interpreting graphs of functions is addressed in a short worksheet. Distance as a function of time is sketched on a graph, and a few quick questions ask about their meaning. This would make a good short assessment, or a nice worksheet to...
5280 Math
Factory Functions
Solve a real-life problem using function-building skills. Presented with an open-ended question, scholars complete a checklist to create and justify a solution in an interesting algebra project. The checklist asks for justifications of...
Curated OER
Graph of a Function
For this graph of a function worksheet, students graph a function and find the value at a given point. They determine the absolute minimum and maximum of an interval. This two-page worksheet contains three problems.
EngageNY
Graphing Quadratic Functions from Factored Form
How do you graph a quadratic function efficiently? Explore graphing quadratic functions by writing in intercept form with a lesson that makes a strong connection to the symmetry of the graph and its key features before individuals write...
EngageNY
Graphs of Functions and Equations
Explore the graphs of functions and equations with a resource that teaches scholars how to graph functions as a set of input-output points. They learn how the graph of a function is the graph of its associated equation.
Curated OER
Lesson 2-5: Absolute Value Functions and Graphs
What is absolute value? What is an absolute value function? Emerging mathematicians solve equations containing variables inside an absolute value sign. They graph each function on a coordinate plane and identify the maximum and minimum...
EngageNY
The Height and Co-Height Functions of a Ferris Wheel
Show learners the power of mathematics as they model real-life designs. Pupils graph a periodic function by comparing the degree of rotation to the height of a ferris wheel.
Saxon
Plotting Functions
Youngsters use a graphing calculator to assist in creating a function table. They graph the function on a coordinate plane. They explore the relationship between the domain and range in the graph. This four-page worksheet contains two...
Flipped Math
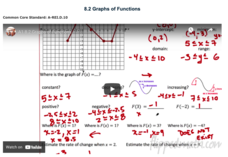
Graphs of Functions
Create a graphical description. Pupils watch a video presentation starting with vocabulary on properties of a graph of a function and then use the vocabulary to find key features of graphs of a function. Scholars use three graphs in the...
Curated OER
Matchstick Math: Using Manipulatives to Model Linear, Quadratic, and Exponential Functions
Playing with matches (unlit, of course) becomes an engaging learning experience in this fun instructional unit. Teach pupils how to apply properties of exponential functions to solve problems. They differentiate between quadratic and...
Curated OER
Graphing Practice
Click on the download box to access this useful graphing lesson that includes worksheets for homework, assessment, and classroom work. The class graphs basic linear functions. They rewrite the equations from standard form into...
Curated OER
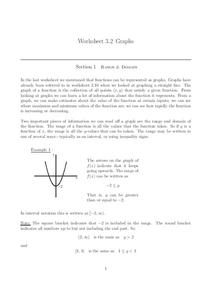
Graphs
In this graphs worksheet, learners solve and complete 15 various types of problems. First, they determine the range of the function of the graph shown and write in interval notation. Then, students find the domain of the function in the...
Embedded Math
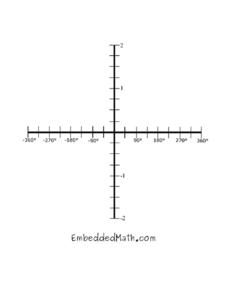
Trig Graph
You and your learners will enjoy having many copies of this trigonometric graph set on the Cartesian coordinate grid with a domain running from -360 degrees to 360 degrees and a range running from -2 to 2.
West Contra Costa Unified School District
Graphing Exponential Functions
Once you know how to graph y = b^x, the sky's the limit. Young mathematicians learn to graph basic exponential functions and identify key features, and then graph functions of the form f(x) = ab^(x – h) + k from the function f(x) = b^x.
Other popular searches
- Continuous Graph
- Graph Function Tables
- Trigonometry Functions Graph
- Function Table Graph
- Linear Functions to Graph
- Function Graph
- Sine Function Graph
- Logarithmic Function Graph
- Graph Function and Integers
- Continuous Line Graph
- Nonlinear and Linear Graph
- Function. Graph


