Curated OER
Velocity of Traffic on Highway 26
Physics fanatics time five cars as they pass on the highway. They use the times and a 20-yard distance to calculate velocity. They also graph distance vs. time. A page of student pre-lab questions is provided in addition to the activity...
Kenan Fellows
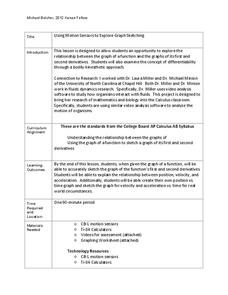
Using Motion Sensors to Explore Graph Sketching
Get moving to a better understanding of graphs of derivatives. Using motion sensors, scholars vary their velocities to create graphs of the first derivative of a function. The activity challenges groups to first create a script of the...
Curated OER
Velocity and Acceleration
Compliment your physics lesson with this PowerPoint which demonstrates many important points regarding acceleration and velocity. A starter experiment activity to stimulate student thinking is given, and may prove very interesting to a...
Illustrative Mathematics
Velocity vs. Distance
At the end of this activity, your number crunchers will have a better understanding as to how to describe graphs of velocity versus time and distance versus time. It is easy for learners to misinterpret graphs of velocity, so have them...
Curated OER
Reading Graphs
Working independently or in teams, your class practices connecting graphs, formulas and words. This lesson includes a guided discussion about distance vs. time graphs and looking at how velocity changes over time.
Physics Classroom
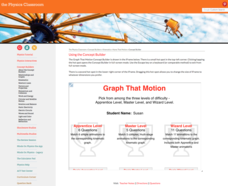
Graph That Motion
Pupils apply their knowledge of the shape and slope of graphs to interpret the motion of an object. Three levels of difficulty provide plenty of practice with support thanks to the "Help Me!" button offered with each question.
Teach Engineering
Matching the Motion
It is not always easy to walk the straight and narrow. In the sixth portion of a nine-part unit, groups actively recreate a graph depicting motion. Individuals walk toward or away from a motion detector while trying to match a given...
Edmond Public Schools
8th Grade Science Resource Book: Unit 2 - Physics
Get things moving with this extensive collection of physical science resources. Covering the fundamentals of measurement, graphing, lab safety, and experimental design as well as the specific scientific concepts of velocity,...
NASA
Ascent: 50 Seconds to MECO
All systems go! With a video and a Google Earth tour as background, pairs investigate two graphs. The graphs display acceleration vs. time and velocity vs. time of a space shuttle launch. Using graphing calculators, the pairs take a...
CK-12 Foundation
Irwin and Ruthie
Learners compare acceleration to displacement through an interactive tutorial that permits them to adjust the running strategy of two robots and watch them race. A graph displays the robot's velocity over time and another shows their...
Curated OER
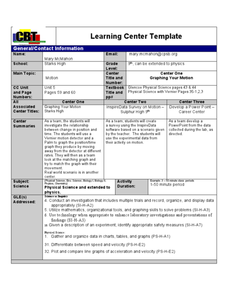
"Graphing Your Motion"
Students study the concepts of motion, velocity, and acceleration through graphing their own movement using LoggerPro. They explain the difference between speed and velocity using the weather vane example. They discover the difference...
Curated OER
Escape Velocity
Sixth graders create/use spreadsheets to solve real-world problems, explore patterns, make predictions, select/explain most appropriate types of graph to display data, use information to create product, and have basic understanding of...
Concord Consortium
Pendulum and Spring
Up, down, back, and forth. When you make a pendulum out of a spring, there's a lot to observe. Aspiring masters of motion examine the combined kinetic energies of spring and pendulum motion using a detailed interactive. Learners observe...
PHET
Forces and Motion
The average American will move 12 times, which results in a lot of moving furniture! Class members consider the forces required to move objects with a creative simulation that opens with the forces required to push a filing cabinet....
Curated OER
Acceleration Lab
Young Einsteins experiment with the acceleration of Hot Wheels™ toy cars down inclined planes at various angles. This classic physics lab activity is thoroughly explained in both a teacher’s guide and a student lab sheet. Science...
Curated OER
Acceleration Science
In collaborative groups, physics learners design and create a web portfolio of internet resoucres explaining poitive and negative acceleration, zero acceleration, and positive and negative velocity. This is a terrific assignment for...
Teach Engineering
Exploring Acceleration with an Android
Small groups use rubber bands to accelerate an Android device along a track of books. They collect the acceleration data and analyze it in order to determine the device's velocity.
Curated OER
Speed
Fifth and sixth graders practice working in pairs to determine whether they can walk with constant speed. They test themselves, collect their data, draw graphs with their data collected, manipulate the data, and then draw conclusions...
Curated OER
Elevator Height as Integral of Velocity
Pupils investigate integrals and their relationship to velocity in this calculus lesson plan. They use the idea of a moving elevator to explore vertical motion and use the TI to help them create a visual.
Las Cumbres Observatory
Craters in the Classroom
Laws of motion apply both in space and on Earth. Young experimenters model object impact on the Earth and moon. They use data to determine the effect mass and velocity have on the resulting craters and how that relates to the energy of...
College Board
Frozen in Time
Take a closer look at increasing and decreasing behavior by zooming in on graphs. An AP® Calculus reference document examines how increasing/decreasing behavior should be considered in terms of intervals rather than points. The resource...
Kenan Fellows
Man vs. Beast: Approximating Derivatives using Human and Animal Movement
What does dropping a ball look like as a graph? An engaging activity asks learners to record a video of dropping a ball and uploading the video to software for analysis. They compare the position of the ball to time and calculate the...
CK-12 Foundation
Butterfly Stroke
Swimmers improve their times by understanding the physics of their sport. As a swimmer moves through the water, the efficiency of motion affects the resulting velocity. Through an interactive simulation, pupils change the level of motion...
Kenan Fellows
Analyzing Speed from Different Modalities
Show us your moves. Using sensor equipment, scholars track the motion of different movements, such as jogging, skipping, or jump roping. They analyze velocity and acceleration and create graphs representing each movement.


