Curated OER
Does cloud type affect rainfall?
Student use MY NASA DATA to obtain precipitation and cloud type data. They create graphs of data within MY NASA DATA. Students compare different cloud types, compare precipitation, and cloud type data They qualitatively describe graphs...
California Academy of Science
California's Climate
The United States is a large country with many different climates. Graph and analyze temperature and rainfall data for Sacramento and Washington DC as you teach your class about the characteristics of Mediterranean climates. Discuss the...
Illustrative Mathematics
Telling a Story With Graphs
Turn your algebra learners into meteorologists. High schoolers are given three graphs that contain information about the weather in Santa Rosa, California during the month of February, 2012. Graph one shows temperatures, graph two...
Curated OER
Frequency, Histograms, Bar Graphs and Tables
In this frequency instructional activity, students interpret histograms, bar graphs and tables. They examine frequency charts and comparison line graphs. This three-page instructional activity contains 4 problems. Answers are provided...
Curated OER
Fourth Grade Science
In this science worksheet, 4th graders answer multiple choice questions about natural objects, rainfall, the solar system, and more. Students complete 25 questions.
Curated OER
Measuring Rainfall and Relationships Between pH, Alkalinity and Suspended Solids in the Pago River
Eleventh graders test the pH and alkalinity of Pago River. In this ecology lesson, 11th graders collect data and use spreadsheet to graph results. They analyze and share their findings with the class.
Curated OER
Make a Line Graph
In this make a line graph learning exercise, 6th graders make a line graph for 2 sets of data, using a blank grid, by plotting the numbers, labeling the x and y axes and writing a title.
Curated OER
Charting and Graphing Sales
Students analyze graphs, charts and tables. In this data analysis lesson, students practice creating and analyzing charts, graphs and tables corresponding to sales and surveys. This lesson uses data relevant to students and includes...
Curated OER
Comparing Amount of Rainfall in Different Geographical Areas
Third graders create rain gauges and take them home. Individually, they record the rainfall amounts at all of their homes over a 2-week period and then bring the data back to class so they can compare the different amounts of rainfall...
Chicago Botanic Garden
Plant Phenology Data Analysis
Beginning in 1851, Thoreau recorded the dates of the first spring blooms in Concord, and this data is helping scientists analyze climate change! The culminating instructional activity in the series of four has pupils graph and analyze...
Curated OER
Precipitation in Michigan Cities
Third graders investigate the rainfall amounts in four Michigan cities to observe how cities near lakes are affected differently by precipitation than those that are inland. They record the rainfall for the cities over an eight day...
Curated OER
Graphing and Analyzing Biome Data
Students explore biome data. In this world geography and weather data analysis lesson, students record data about weather conditions in North Carolina, Las Vegas, and Brazil. Students convert Fahrenheit degrees to Celsius degrees and use...
Curated OER
Recognizing Bias in Graphs
In this bias in graphs worksheet, students examine graphs and explain the data. They determine why the graph is or is not biased. This four-page worksheet contains approximately 6 problems. Explanations and examples are provided.
Curated OER
Interpreting Graphs: Temperate Climates
In this interpreting graphs worksheet, students read a graph containing data of rainfall and temperature, then complete 18 questions, interpreting the data.
Curated OER
Measuring Rainfall
Students experiment to find out how rain is measured. In this rainfall measurement lesson, students experiment to observe the effects of rainfall and how much of it fell.
Curated OER
Weather
Students create a spreadsheet and chart using data collected. In this weather lesson, students select five cities from their state, including the city they live in. Students take daily temperature readings from all five cities. ...
Curated OER
Differences between Climate and Weather
Students collect weather data over weeks, graph temperature data and compare the temperature data collected with averaged climate data where they live.
Curated OER
Climatographs
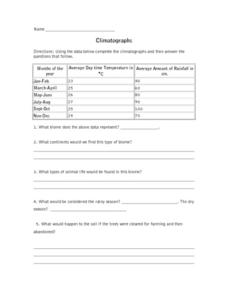
In this climatographs worksheet, students are given 3 sets of data of the rainfall and temperature for 3 different biomes. Students identify the types of biome for each and answer questions about each. They make 2 graphs to compare the...
Curated OER
Organizing Data
In this organizing data instructional activity, 7th graders solve seven different types of problems related to data. They first identify the type of data as categorical, discrete or continuous from the information given. Then, students...
Curated OER
Does Cloud Type Affect Rainfall?
Student uses MY NASA DATA to obtain precipitation and cloud type data. They create graphs of data within MY NASA DATA. They compare different cloud types as well as precipitation types. They describe graphs of the precipitation and cloud...
Curated OER
El Nino and Rainfall
Students examine the relationship between El Nino and rainfall. They view an animation that simulates the various ocean currents, and analyze data from rainfall tables.
Chicago Botanic Garden
Climate Change Around the World
Look at climate change around the world using graphical representations and a hands-on learning simulation specified to particular cities around the world. Using an interactive website, young scientists follow the provided directions to...
National Wildlife Federation
Hot, Hotter, Hottest: Extreme Weather's Impact on Our Resources
How dry is it? It's so dry, the river only runs twice a week! Through an analysis of maps and discussions, pairs learn about droughts across the United States in the ninth of 12 lessons. They then read about, answer questions, analyze...
Curated OER
Climate Types
In this weather worksheet, students describe the rainfall distribution found in two different areas of the world. Then they compare the various types of climates found around the world using the graphs shown on the sheet.


