Curated OER
Graphing Climate Information
Seventh graders plot the data for the average monthly precipitation for three cities. They make a graph using a spreadsheet.
Curated OER
Farming - Ireland
In this farming instructional activity, students explain what is meant by sustainable development. Students review how rain develops. Students determine how climate effects crops that can be farmed. This instructional activity has 4...
Texas Instruments
Land Erosion - Running Off With Soil
Learners evaluate the relationship between rainfall and runoff of a small island for one year. In this rainfall vs. runoff lesson, students analyze the relationship between the rainfall and the runoff on Barro Colorado Island over a...
Curated OER
Communicating Data
In this data instructional activity, students match information with the best type of graph to display it. Students also make a chart and graph to display information in a given paragraph.
Captain Planet Foundation
Shape Shifters in the Math Garden
Combines mathematical measurement with gardening skills. Third graders hunt for worms in the garden and try to find the longest one. They also measure and weigh vegetables that they harvest from the garden, measure rainfall amounts, and...
Living Rainforest
Finding the Rainforests
From Brazil to Indonesia, young scientists investigate the geography and climate of the world's tropical rain forests with this collection of worksheets.
Curated OER
Creating Climographs
Young scholars use satellite data to compare precipitation and surface temperatures on different islands. In this satellite instructional activity students create graphs and explain the differences between weather and climate.
Curated OER
Analyzing Tree Rings to Determine Climate Change
Students examine how to locate and access data sets. In this climate change lesson students import data into Excel and graph it.
Curated OER
Rainforest Data
In this geography worksheet, students use the climate data given to create a temperature line graph and rainfall bar graph for each of three locations given. Then they use an atlas to compare their graphs and draw conclusions about the...
Curated OER
Comparing Amount of Rainfall in Different Geographical Areas
Students construct rain gauges and use them to log rainfall in their school zone, local city, and region and then compare and discuss them by plotting this information.
Curated OER
Water Pollution Graphing Activity
Young scholars describe and identify the link between land use activities within a watershed and water quality. They evaluate the quality of a "water sample" ( a bag of skittles), graph their results, and form a hypothesis about the land...
Curated OER
Creating Climographs
Students chart statistical information on graphs, interpret the information and use it to explain spatial relationships, and identify the relationship between climate and vegetation.
Curated OER
Rain Forests: A Disappearing Act?
Students examine and locate rainforests on maps, and research the patterns of their destruction. They develop a bar graph of rainfall and temperature data, write a journal entry, and research the people, animals, and plants/products of...
Curated OER
The Geography of Africa
Hop a flight to Africa in this presentation, which includes brilliant and appealing photographs of the continent as well as maps and graphs about its geography, topography, and climate. Those who are researching Africa for a project or...
Curated OER
Hot, Wet, and Cold
Students research climate data for a city in each of the 5 major geographic sections of Texas. They use data to describe the climate and what influence the geography of that section has on the weather.
Curated OER
Canada's Climate: Temperature and Rainfall Variations
Middle schoolers analyze data about various climates in Canada. In this data analysis and climate lesson, students use Canada Year Book 1999 to complete a worksheet and make connections between precipitation and temperature in different...
Curated OER
Rain On
Fourth graders study the water cycle and clouds. In this water cycle and cloud lesson, 4th graders determine the definition of condensation and watch a demonstration in which the teacher makes a cloud in a bottle. They discuss the water...
Curated OER
Is the Hudson River Too Salty to Drink?
In this estuary worksheet, students examine data about the salinity of the Hudson River, create a graph from given data and complete 12 short answer questions about the data and graph.
Curated OER
Rainforest Unit
Students investigate the Rainforest. In this Rainforest lesson, students research magazines, journals and the Internet to create a "Save the Rainforest" slogan. Students will record local rainfall amounts and create a graph comparing...
Curated OER
Using Climographs to Compare and Contrast Two Climates
In this climograph worksheet, students graph the temperature and precipitation of two cities, Nepal and West Palm Beach. They compare the two cities and answer questions about climographs.
Curated OER
Animals Finding Rice Paddies
Fourth graders examine the animals who live in rice paddies and create a chart. In this rice lesson, 4th graders link the types of animals living in each ecosystem with a bar graph. Students use colored bars to show animals that live in...
Curated OER
Let the Rain Come Down!
Second graders construct a bar graph comparing local precipitation to that of the Yucatan. In this graphing lesson, 2nd graders will use conversions and problem solving strategies.
Curated OER
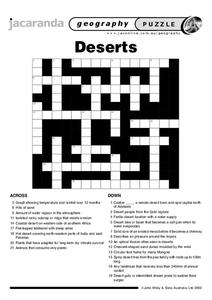
Deserts Puzzle
In this geography worksheet, students complete a crossword puzzle referring all to deserts. They identify the various types of desert land and what plants and animals can survive in these lands. Also, students identify the people who...
Curated OER
Spreadsheets and Database in Social Studies
Fifth graders create/use spreadsheets to solve real-world problems, explore patterns and make predictions, select/explain most appropriate types of graph to display data, and enter data into a prepared spreadsheet to perform calculations.


