American Statistical Association
Happy Birthday to . . . Two?
How many people do you need in a room before two likely share the same birthday? Scholars consider this puzzle by analyzing a set of data. They ponder how to divide the data and determine the proper size of a group for this event to...
Curated OER
Using Random Sampling to Draw Inferences
Emerging statisticians develop the ability to make inferences from sample data while also working on proportional relationships in general. Here, young learners examine samples for bias, and then use random samples to make inferences...
American Statistical Association
Scatter It! (Predict Billy’s Height)
How do doctors predict a child's future height? Scholars use one case study to determine the height of a child two years into the future. They graph the given data, determine the line of best fit, and use that to estimate the height in...
Inside Mathematics
Scatter Diagram
It is positive that how one performs on the first test relates to their performance on the second test. The three-question assessment has class members read and analyze a scatter plot of test scores. They must determine whether...
Western Kentucky University
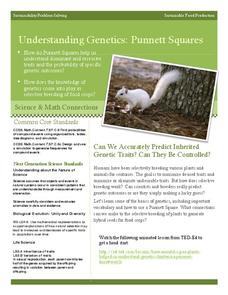
Understanding Genetics: Punnett Squares
Can scientists really predict genetic outcomes or are they simply making a lucky guess? Scholars first learn about Gregor Mendel and how to make Punnett squares. Then they extract DNA from a strawberry in a lab with included conclusion...
Houghton Mifflin Harcourt
Around Town: Neighborhood and Community: English Language Development Lessons (Theme 3)
Here is a unit designed to support English language development. Scholars speak, move, and write to learn more about topics that focus on community and local concepts. The series of lessons aids to reinforce concepts including consonant...
Houghton Mifflin Harcourt
Off to Adventure!: English Language Development Lessons (Theme 1)
Give language skills a boost with a series of ESL lessons in an Off to Adventure! themed unit. Using a speak, listen, move, and look routine, scholars enhance proficiency through grand conversation and skills practice. Discussion topics...
Mathalicious
On Your Mark
With many factors leading to a great athlete, does height make Usain Bolt unfairly fast? Middle schoolers conduct analysis to change the running distance of the Olympic races to be proportional to the height of the participants. They...
Houghton Mifflin Harcourt
We’re a Family: English Language Development Lessons (Theme 3)
Teach your English language learners how to talk about their families with three weeks of lessons. Over the course of the thematic unit, learners pick up new vocabulary so that they can talk about families and relationships, clothing,...
Albert Shanker Institute
Economic Causes of the March on Washington
Money can't buy happiness, but it can put food on the table and pay the bills. The first of a five-lesson unit teaches pupils about the unemployment rate in 1963 and its relationship with the March on Washington. They learn how to create...
S2tem Centers SC
Investigating Chance Processes of Probability
How likely is it that the school cafeteria will serve chicken tomorrow? Discover the concept of probability with the roll of the dice. Pupils evaluate the liklihood of several statments about everyday life. Then, a mathematical...
American Statistical Association
How Tall and How Many?
Is there a relationship between height and the number of siblings? Classmates collect data on their heights and numbers of brothers and sisters. They apply statistical methods to determine if such a relationship exists.
Curated OER
Students Analyze Data With Scatter Plots
Scatter plot lessons can help students create different types of graphs by hand or with the aid of technology.
Noyce Foundation
Counters
For some, probability is a losing proposition. The assessment item requires an understanding of fraction operations, probability, and fair games. Pupils determine the fractional portions of an event. They continue to determine whether...
Houghton Mifflin Harcourt
Special Friends: English Language Development Lessons (Theme 9)
Enhance language proficiency with a Special Friends themed English language development unit. Each lesson follows a listen, speak, move, and/or look routine that is guaranteed to get your scholars discussing topics such as animal...
Achieve
Ground Beef
Ever wonder how a butcher creates the different types of ground beef? Young mathematicians explore the methods butchers use to create their desired ground beef quality. Given a combination of two types of meat with varying leanness,...
American Statistical Association
Tell it Like it is!
Scholars apply prior knowledge of statistics to write a conclusion. They summarize using correct academic language and tell the story of the data.
Houghton Mifflin Harcourt
Smart Solutions: English Language Development Lessons (Theme 6)
Smart Solutions is the theme of a unit created to meet the needs of English language earners. Through a series of lessons, scholars follow a routine—move, speak, and listen— to cover topics including stores, shops, celebrations, pets,...
Illustrative Mathematics
Mr. Brigg's Class Likes Math
A quick discussion question that brings some collaboration into your classroom will allow your thinkers to make a decision about sampling. Mr. Briggs wants to know if the results from his class are a valuable comparison to the entire...
Curated OER
Estimating the Mean State Area
Seventh grade statisticians randomly select five states and then determine the mean area. The class then works together to create a dot plot of their results.
Curated OER
The Miracle Fish: Learning to Design an Experiment
Students develop procedures to explore the behavior of fish. In this scientific experiment lesson students from a hypothesis, write a question, identify different variables and controls in their experiment.
Noyce Foundation
Ducklings
The class gets their mean and median all in a row with an assessment task that uses a population of ducklings to work with data displays and measures of central tendency. Pupils create a frequency chart and calculate the mean and median....
Achieve
Task: Storage Sheds
Bridge the gap between mathematics and Career Technical Education. Pupils research the cost associated with building storage sheds and analyze possible profit. They build scale models and determine if building and selling the sheds is a...
Curated OER
Birds' Eggs
More than just data, scatter plots are full of information that can be used to answer a variety of questions. This lesson uses a plot with information about bird egg sizes to answer questions about the relationship between length and...


