Scholastic
Study Jams! Identify Outcomes and Make Predictions
Boy, girl, girl, boy? Make a prediction on what kind of puppies you are going to get during this video that introduces outcomes. Knowing how to make an educated prediction is even more important, and this lesson focuses on what to look...
EngageNY
Using Sample Data to Estimate a Population Characteristic
How many of the pupils at your school think selling soda would be a good idea? Show learners how to develop a study to answer questions like these! The activity explores the meaning of a population versus a sample and how to interpret...
Curated OER
Predicting Outcomes I: Post Test
In this predicting outcomes worksheet, students complete multiple choice questions about how to predict outcomes of a situation. Students complete 8 questions total.
New York City Department of Education
How I Roll
There's a high likelihood for learner success in this set of probability problems and activities. From support activities that walk learners through joint and compound probabilities through the cumulative activity of planning to win a...
Curated OER
Discussing How Plants Grow
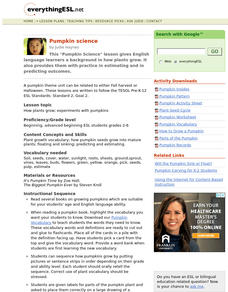
Study how plants grow with your English language learners with a cross-curricular lesson revolving around pumpkins. These activities provide opportunities to practice new scientific vocabulary while practicing skills such as estimating...
Kenan Fellows
Applying Linear Regression to Marathon Data
It's not a sprint, it's a marathon! Statistic concepts take time to develop and understand. A guided activity provides an opportunity for individuals to practice their linear regression techniques in spreadsheet software. The activity...
EngageNY
Informally Fitting a Line
Discover how trend lines can be useful in understanding relationships between variables with a lesson that covers how to informally fit a trend line to model a relationship given in a scatter plot. Scholars use the trend line to make...
Curated OER
Using Random Sampling to Draw Inferences
Emerging statisticians develop the ability to make inferences from sample data while also working on proportional relationships in general. Here, young learners examine samples for bias, and then use random samples to make inferences...
Curated OER
Likely Outcomes
A coin toss is a simple and fun way to help youngsters discovery probability. Preferably in partners, they first predict what would happen if they tossed two coins 48 times. How often would two heads show up? Two tails? How about one of...
EngageNY
Designing a Search Robot to Find a Beacon
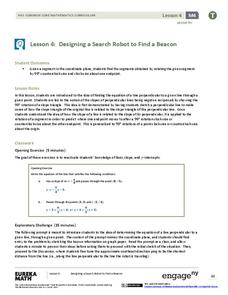
Build right angles using coordinate geometry! Pupils explore the concept of slope related to perpendicular lines by examining 90-degree rotations of right triangles. Learners determine the slope of the hypotenuse becomes the opposite...
University of North Carolina
Psychology
Psychology, the scientific study of the human mind and behavior, is a popular major for many college students. An informative handout outlines common assignments in psychology courses. Scholars see how to design a research proposal,...
EngageNY
Comparing Estimated Probabilities to Probabilities Predicted by a Model
Small groups devise a plan to find the bag that contains the larger percentage of blue chips. they then institute their plans and compare results to the actual quantities in the bags.
Houghton Mifflin Harcourt
Voyagers: Extra Support Lessons (Theme 5)
This packet, the third in the series of support materials for the Houghton Mifflin Harcourt thematic units on voyagers, contains activities for learners who may struggle with the basic concepts of the lessons. Included are lessons on how...
Serendip
Understanding How Genes Are Inherited via Meiosis and Fertilization
Bring the excitement of genetics to scholars with a dynamic hands-on meiosis modeling experience. During the activity, biologists follow step-by-step procedures to build chromosomes, model independent assortment, learn about crossing...
National Wildlife Federation
The Tide is High, but I’m Holding On… Using ICESat Data to Investigate Sea Level Rise
Based on the rate of melting observed from 2003-2007 in Greenland, it would take less than 10 minutes to fill the Dallas Cowboys' Stadium. The 17th lesson in a series of 21 has scholars use the ICESat data to understand the ice mass...
US Department of Agriculture
Sink or Float?
Will it sink or will it float? Learners predict the outcome as they drop random objects into a container of water. Then, they keep track of the results and record the data in a t-chart to draw a final conclusion.
EngageNY
Determining the Equation of a Line Fit to Data
What makes a good best-fit line? In the 10th part of a 16-part module, scholars learn how to analyze trend lines to choose the best fit, and to write equations for best-fit lines to make predictions.
EngageNY
Calculating Probabilities of Events Using Two-Way Tables
Tables are useful for more than just eating. Learners use tables to organize data and calculate probabilities and conditional probabilities.
EngageNY
Interpreting Residuals from a Line
What does an animal's gestation period have to do with its longevity? Use residuals to determine the prediction errors based upon a least-square regression line. This second lesson on residuals shows how to use residuals to create a...
Virginia Department of Education
Passing Traits to Offspring
What makes each one of us unique? Lead your class in this exciting and educational activity as you uncover traits that show how each individual is different from another. Pupils explore facts about DNA technology and predict the...
Columbus City Schools
Totally Tides
Surf's up, big kahunas! How do surfers know when the big waves will appear? They use science! Over the course of five days, dive in to the inner workings of tidal waves and learn to predict sea levels with the moon as your guide.
EngageNY
More on Modeling Relationships with a Line
How do you create a residual plot? Work as a class and in small groups through the activity in order to learn how to build a residual plot. The activity builds upon previous learning on calculating residuals and serves as a precursor to...
Kenan Fellows
Reaction Stoichiometry—How Can We Make Chalk?
What is a reasonable percent yield in the manufacturing process? Scholars develop a process for producing chalk in the third lesson of a six-part series. Then, they must determine the theoretical and percent yield. Discussions about...
Beyond Benign
Green"er" Precipitation Reaction
All sodium carbonate may not have the same amount of carbonate, but it should have the same percent. Learners write and balance an equation to predict the chemical reaction between sodium carbonate and zinc acetate. Through the lab...


