Curated OER
Lesson #46: Bar Graphs and Line Graphs
In this bar graphs and line graphs instructional activity, students interpret bar graphs, line graphs, and box-and-whisker plots. They find the measures of central tendency. This three-page instructional activity contains notes,...
Curated OER
Bar Graphs and Line Graphs
In this bar graphs and line graphs worksheet, students examine given data, organize it, and create bar graphs and line graphs from the given information. They interpret graphs and write statements explaining the graph. This one page...
Willow Tree
Bar Graphs
Circles, lines, dots, boxes: graphs come in all shapes in sizes. Scholars learn how to make a bar graph using univariate data. They also analyze data using those bar graphs.
Jude Mphoweh
Graphs
Searching for worksheets to include in an elementary math series on bar graphs? Then look no further! This collection of materials has exactly what you need to ensure that your students get plenty of practice reading and analyzing the...
Curated OER
Double Bar Graphs - Homework 7.1
Your learners have seen basic bar graphs, but do they have experience reading double bar graphs? This worksheet details how to draw a double bar graph and provides an example with six accompanying questions. The final question asks...
Curated OER
Double Bar Graphs - Practice 7.1
In this double bar graph learning exercise, students make a double bar graph from given information, then solve related problems in addition to 2 test prep problems. Houghton Mifflin text referenced.
Houghton Mifflin Harcourt
Use a Graph: Measure Fish
Something's fishy here! Use the bar graph provided to determine the length of each fish shown. Small cartoon fish make this an engaging worksheet for young learners. There are six questions provided.
Curated OER
Learning to Read Graphs
What is your favorite pet? This is a great tool for youngsters just learning how to read and interpret graphs. There are four simple questions. Consider extending this activity by creating a class bar graph: how many learners have a dog,...
Curated OER
Learning to Read Graphs 2
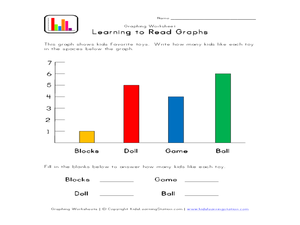
Do you like playing with blocks, dolls, games, or balls? Use this basic graph to review bar graphs with young learners. After completing the four questions below, consider creating your own class graph: who likes blocks the best? Who...
Curated OER
Interpreting a bar chart
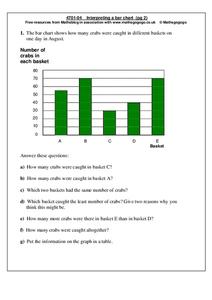
In this bar chart worksheet, students analyze a bar chart and answer 7 questions pertaining to the information on the chart. The answers are on the second page.
Curated OER
Frequency, Histograms, Bar Graphs and Tables
In this frequency worksheet, students interpret histograms, bar graphs and tables. They examine frequency charts and comparison line graphs. This three-page worksheet contains 4 problems. Answers are provided on the last page.
Curated OER
Use a Graph
Information is often presented in graph form. Can your youngsters read a basic bar or picture graph? Six word problems accompany three graphs. One graph is a bar graph and the other two are pictographs.
Curated OER
Graphs: Students in Math Classes
Are your second and third graders just beginning to read bar graphs? This graph looks at the number of learners present in a math class Monday-Friday. Learners look for basic information, and the graph is easy to read.
Curated OER
How Soluble Is It?
Is sugar more soluble than salt? Experiment with water and solubility with an elementary science activity. After interpreting data from a bar chart, fifth graders use different types of sugar to determine if the size of sugar particles...
Curated OER
Interpreting a Bar Chart
In this interpreting bar charts activity, students examine a bar chart that shows how many people traveled on boats that took them out dolphin watching. They answer 8 questions about the times and number of people on the boats.
Curated OER
Mental Math: Subtract Tens, Problem Solving
Subtracting by 10s is easy for your young learners with this worksheet! There are three questions to accompany a bar graph, and there's a space for learners to explain their answers. Encourage them to use mental math here!
Curated OER
Graphs - Online Activity
In this interpreting graphs worksheet, students complete an on-line activity in which they read both a line graph and a bar graph. They answer questions about how many of each letter is shown on a line graph and how many of each child's...
Curated OER
Choose an Appropriate Graph
In this graphs worksheet, students solve 6 fill in the blank problems where they choose the most appropriate type of graph for each set of data and explain why they chose that type. Students use bar graphs, histograms and circle graphs....
Curated OER
Reading Bar Graphs
In this bar graphs activity, 8th graders solve and complete 10 different problems that include interpreting two different bar graphs. First, they determine the least profitable year for selling books. Then, students determine the age...
Curated OER
Bar Graphs and Histograms
In this bar graphs and histograms learning exercise, students create bar graphs and histograms from given information. They interpret graphs. This one-page learning exercise contains 6 multi-step problems.
Curated OER
7th Grade Math Worksheet
In this integers worksheet, 7th graders solve 10 different problems that include various types of integers and graphs. First, they determine the sum of 3 consecutive integers. Then, students find the ratio between 2 areas of similar...
Curated OER
Bar Graph Activity-Kindergarten
In this bar graph worksheet, students interpret a bar graph, writing how many students like each given flavor of ice cream. A reference web site is given for additional activities.
Curated OER
Professor Panda's Pizza Graph
In this data analysis worksheet, students answer 11 questions using a bar graph that was constructed from the answers to a survey about pizza toppings. They use a secret code to determine the best place to have a pizza.
Curated OER
Food for Class Party
In this interpreting a bar graph and math word problems worksheet, 2nd graders read the information about choices of food for a class party and answer various multiple choice questions. Students solve 25 problems.


