Curated OER
Art, Commentary and Evidence: Analysis of "The White Man's Burden"
A cross-curricular lesson combines poetry and history for your middle and high schoolers. The class critically examines Kipling's poem, "White Man's Burden" as historical evidence of the Imperialist ideology popular during his time. The...
CCSS Math Activities
Smarter Balanced Sample Items: 8th Grade Math – Claim 4
A math model is a good model. A slide show presents 10 sample items on modeling and data analysis. Items from Smarter Balanced illustrate different ways that Claim 4 may be assessed on the 8th grade math assessment. The presentation is...
Corbett Maths
Discrete and Continuous Data
Let's be discrete about the types of data. A short video provides the definitions of discrete and continuous data. After providing the definitions, the resource takes different types of data and sorts them based on type and provides an...
CCSS Math Activities
Smarter Balanced Sample Items: High School Math – Claim 4
What is the appropriate model? Sample problems show the extent of the Smarter Balanced assessments Claim 4, Modeling and Data Analysis. Items provide pupils the opportunity to use mathematical modeling to arrive at a reasonable answer....
CCSS Math Activities
Smarter Balanced Sample Items: High School Math – Claim 3
Communication is the key. A presentation provides 25 sample items for Claim 3, Communicating Reasoning, for the Smarter Balanced High School Math assessment. Items require pupils to answer the question and provide logical reasoning to...
Curated OER
Graphs that Represent Data Sets
These four scenarios all contain graphable data; can scholars match them to the correct bar graphs? All the data is in single-digit whole numbers. Some of the scenarios instruct kids to make a graph, while others don't. Clarify...
Curated OER
Estimate and Compare Data
Seventh graders explore the values that are used in order to describe data that is collected or given. They compare data using the statistical analysis provided by finding the mean, median, and range.
Curated OER
Many Ways to Represent Our Data
Demonstrate several ways to represent data with your class. They will use surveys to gather data and display the data using tally charts and graphs. Then answer questions according to the data.
CCSS Math Activities
Smarter Balanced Sample Items: 8th Grade Math – Target J
Look at patterns in bivariate data. Eight sample items illustrate the eighth grade statistics and probability standards. The Smarter Balanced Sample multiple-choice items focus on numerical and categorical bivariate data. The slide show...
Mathematics Vision Project
Modeling Data
Is there a better way to display data to analyze it? Pupils represent data in a variety of ways using number lines, coordinate graphs, and tables. They determine that certain displays work with different types of data and use two-way...
Curated OER
Interpreting Graphs and Analyzing Data
Students investigate graphs and analyze the data displayed in the graph. They read a graph reflecting the birthday data for the students to read and analyze. Students use the graph to determine the number of birthday cards they need to...
Curated OER
Graphs to Represent a Data Set
Here are a some pre-made sets of data that kids can use to practice data analysis. There are 10 survey scenarios written out, and scholars synthesize the results of each into a bar graph. In addition to the graphing, they answer two...
Curated OER
Graphs that Represent Data Sets
Use these pre-made data sets to introduce kids to bar graphs and data analysis, and then have them take surveys on their own. There are 10 survey scenarios written out here, and scholars synthesize the results of each into a bar graph....
Curated OER
Graphs to Represent a Data Set
How many animals did Chaplin see at the zoo? Scholars examine three data sets and create a bar graph for each. Encourage them to label the different parts of their graphs, as this is not prompted on the worksheet. Once they finish their...
Curated OER
Graphs to Represent a Data Set
As your scholars begin to learn how to read graphs, help them pay attention to detail with this matching activity. They read four short data descriptions and match them to one of the four bar graphs pictured. Each graph is labeled along...
Curated OER
Organizing and Understanding Data - Independent Practice
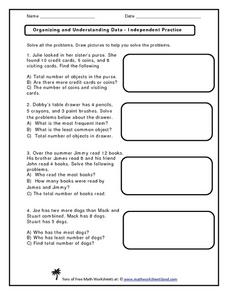
Provide your first graders with an opportunity for independent practice organizing and understanding data. The ten story prompts on this three-page worksheet asks learners to solve problems involving concepts of the total number of...
Curated OER
Neighborhood or Slum? Snapshots of Five Points: 1827-1867
How has your local neighborhood changed throughout recent history? Young researchers evaluate census data, images, and primary source descriptions describing the living situation in the antebellum Five Points neighborhood. They consider...
Curated OER
A Guide to Financial Analysis
Knowing good project management means knowing how to conduct good financial analysis. Learner are introduced to the ins and outs of financial planning as it relates to cost, benefit, and project capital investment.
Curated OER
Differing Federal Responses to the Great Depression: Letter Analysis
Young analysts examine two letters, one written by President Hoover and one written by FDR. Each letter contains that president's response to the role of the Federal Government during times of crisis (The Great Depression). They analyze...
CCSS Math Activities
Smarter Balanced Sample Items: High School Math – Target P
Learn how to show data in varied ways. A PowerPoint presentation provides six questions from the high school SBAC Claim 1 Target P item specifications. It covers creating data representations, interpreting and comparing data, and...
CCSS Math Activities
Smarter Balanced Sample Items: 6th Grade Math – Target G
Making money and saving money turn into high interest topics for sixth graders. Grade 6 Claim 1 Item Slide Shows use these topics in a presentation with math practice problems. The questions require applying knowledge of algebraic...
Kenan Fellows
Designing and Analyzing Data Collected from Wearable Devices to Solve Problems in Health Care
Wearable devices have become more the norm than the exception. Learners analyze data from a sample device with a regression analysis in a helpful hands-on lesson. Their focus is to determine if there is a connection between temperature...
Brigham Young University
Introducing the Text and Learning the Process of Script Analysis
Where do directors and set designers get their ideas so that the set they build creates the mood and atmosphere the director wants for a production? From the script! Introduce theater high schoolers to the script analysis techniques used...
Curated OER
Who Freed the Slaves During the Civil War?
Pose the question to your historians: who really freed the slaves? They critically assess various arguments, using primary sources as evidence. In small groups, scholars jigsaw 5 primary source documents (linked), and fill out an...


