Curated OER
Interpreting Functions
Interpreting graphs of functions is addressed in a short worksheet. Distance as a function of time is sketched on a graph, and a few quick questions ask about their meaning. This would make a good short assessment, or a nice worksheet to...
Mathematics Assessment Project
Interpreting Distance–Time Graphs
Pre-algebra protégés critique a graph depicting Tom's trip to the bus stop. They work together to match descriptive cards to distance-time graph cards and data table cards, all of which are provided for you so you can make copies for...
Curated OER
Interpreting Algebraic Expressions
Interpreting algebraic expressions is a fundamental skill in beginning algebra. This activity approaches the task in numerous ways. First, learners assess their understanding with a short worksheet on converting between words and...
Curated OER
Math: Navigating the World Around Me
Young mathematicians research and discuss real world math word problems and ways in which they apply math concepts in their everyday lives. They create a storyboard of a math word problem from which they create a slide for a multi-media...
Mathematics Assessment Project
Bike Ride
As a middle school assessment task, learners interpret the graph of distance versus time for a bike ride. Pupils then determine distance of the trip, length of the trip, and speeds.
Curated OER
Maps and Modes, Finding a Mean Home on the Range
Fifth graders investigate data from maps to solve problems. In this data lesson, 5th graders study maps and collect data from each map. Students present their data in a variety of ways and calculate the mode, mean, median, and range.
Mathematics Assessment Project
Journey
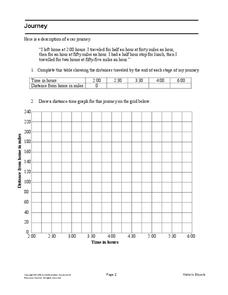
Drive home math concepts with an engaging task. Learners follow a verbal description to fill in a table and create a distance-time graph representing a car journey. They then answer questions by interpreting the graph.
Bowland
Alien Invasion
Win the war of the worlds! Scholars solve a variety of problems related to an alien invasion. They determine where spaceships have landed on a coordinate map, devise a plan to avoid the aliens, observe the aliens, and break a code to...
Prince William Network
Migration Math Madness
A great way to incorporate math into life science, this lesson has learners measure migratory routes on a map and calculate the actual distance that shorebirds on the routes would cover. Learners compute the distance covered in both...
Curated OER
Great Lakes Homepage for Kids
Here are some outstanding lessons on the geology and history of the Great Lakes. These lessons are divided into Grade 4 -6, and Grade 7 - 8 activities. The activities all use the background information, maps, graphs, data, and Great...
Inside Mathematics
Vencent's Graphs
I like algebra, but graphing is where I draw the line! Worksheet includes three multiple-part questions on interpreting and drawing line graphs. It focuses on the abstract where neither axis has numbers written in, though both are...
Mathematics Assessment Project
Modeling: Making Matchsticks
Math: The only subject where the solution to a problem is seven million matches. Young scholars first complete an assessment task estimating the number of matches they can make from a tree of given dimensions. They then evaluate provided...
Mathematics Assessment Project
Solving Linear Equations
Linear equations are the focus of activities that ask learners to first complete a task that involves interpreting algebraic expressions and solving linear equations. They then take part in a card activity matching equations, situations,...
Curated OER
Charts, Maps, and Graphs Lesson on the Holocaust
High schoolers practice interpreting data. In this Holocaust lesson, students research selected Internet sources and examine charts, maps, and graphs regarding the Jewish populations in and out of Europe. High schoolers respond to...
Mathematics Assessment Project
Sugar Prices
Sugar rush! In this assessment task, learners interpret points on a scatter plot representing price versus weight for bags of sugar. They then determine the bag that represents the best value.
Curated OER
Christopher Columbus: The Man, the Myth, the Legend
Learn more about maps by examining Christopher Columbus's voyage to the New World. Kindergartners will learn about basic map skills and how to identify the compass rose, oceans, and land masses. They will also discover the purpose of...
Curated OER
Interpreting Statistics: A Case of Muddying the Waters
Is river pollution affecting the number of visitors to Riverside Center, and is the factory built upstream the cause of the pollution? Let your class be the judge, literally, as they weigh the statistical evidence offered by the factory...
Illustrative Mathematics
Latitude
The greater the latitude, the less of the Earth is north. Scholars graph the relationship between the latitude and the percentage of the Earth that is north of the latitude. Using the graph and the table, class members interpret values...
Alabama Learning Exchange
Coordinate Geometry
Where do the coordinates lead? As children brainstorm ways to find the location of different buildings, they learn about coordinate points and how to use them to locate areas on a grid or map. They practice using ordered pairs by playing...
Balanced Assessment
Ford and Ferrari
Which is faster, a Ford or a Ferrari? The short assessment has pupils analyze graphs to determine the rates of change between the two. Individuals interpret the rates of change within the context of speeds of the cars and develop a map...
Curated OER
The Treasure Map
Third graders problem solve using drawings and map interpretations. They preview graphs and Cartesian geometry. They follow directions on a map using a grid and compass references while simulating they are reading a pirate map.
Curated OER
Local History: Mapping My Spot
Students explore maps to discover historical information about their local area. In this mapping and history instructional activity, students use panoramic maps of their own town/city to interpret historical information. Students also...
Mathematics Assessment Project
Identifying Similar Triangles
Math whizzes work with angle sums and exterior angles to figure out the measure of other angles. This particular publication provides comprehensive support in the form of an anticipatory activity, questions designed to prompt discussion,...
Curated OER
Map that Habitat
Students participate in an activity that replicates the creation of sea floor bathymetry by taking a simplified form of soundings in the classroom. They discuss sea floor mapping technologies, sonar, soundings, and remote sensing,...


