Curated OER
Lesson 2-5: Absolute Value Functions and Graphs
What is absolute value? What is an absolute value function? Emerging mathematicians solve equations containing variables inside an absolute value sign. They graph each function on a coordinate plane and identify the maximum and minimum...
West Contra Costa Unified School District
Using Derivatives to Graph Polynomials
You can learn to graph as well as a calculator using calculus. The lesson introduces using derivatives to find critical points needed to graph polynomials. Pupils learn to find local maximums and minimums and intervals of increase and...
Flipped Math
Graphing Polynomial Functions
Take a look in the window. Pupils watch a presentation to discover how to graph a polynomial using a graphing calculator and using the window to find the extrema. Scholars use their knowledge from previous lessons to gain a rough idea of...
Curated OER
Maximum and Minimum of Functions
In this calculus worksheet, students are given functions and values to derive using the functions. They are asked to find the maximum, minimum and point of inflection. There are 28 questions.
West Contra Costa Unified School District
Key Features of Graphs
The key is ... After a day of instruction on key features of graphs, groups create a poster and presentation on the key features of their given function graph. The resource provides an extension activity of "telephone" using graphs.
Flipped Math
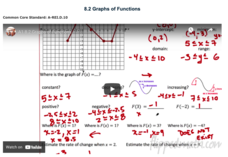
Graphs of Functions
Create a graphical description. Pupils watch a video presentation starting with vocabulary on properties of a graph of a function and then use the vocabulary to find key features of graphs of a function. Scholars use three graphs in the...
EngageNY
Graphing the Sine and Cosine Functions
Doing is more effective than watching. Learners use spaghetti to discover the relationship between the unit circle and the graph of the sine and cosine functions. As they measure lengths on the unit circle and transfer them to a...
Flipped Math
Calculus AB/BC - Sketching Graphs of Functions and Their Derivatives
Find deeper meaning in graphs. Pupils use the knowledge gained from the previous sections in the unit to sketch graphs of a function's derivative. Learners also see how to sketch a graph of a function given the graph of its derivatives....
Curated OER
Derivatives and Maximum or Minimum
In this calculus worksheet, students calculate the maximum, minimum, and determine if the graph is concave up or down. There are 2 questions.
Curated OER
Applied Maximum/Minimum Problems
In this maximum and minimum worksheet, students determine the dimensions of given figures inscribed within other figures or within graphs. This one-page worksheet contains seven dimension problems.
Shodor Education Foundation
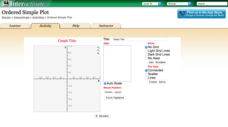
Ordered Simple Plot
Open your imagination to make algebra-inspired creations. An interactive lesson has scholars graph images from a set of parameters. Users can practice minimum values, maximum values, and scale as well as key features.
Illustrative Mathematics
Telling a Story With Graphs
Turn your algebra learners into meteorologists. High schoolers are given three graphs that contain information about the weather in Santa Rosa, California during the month of February, 2012. Graph one shows temperatures, graph two...
EngageNY
Graphing Factored Polynomials
Young mathematicians graph polynomials using the factored form. As they apply all positive leading coefficients, pupils demonstrate the relationship between the factors and the zeros of the graph.
EngageNY
Graphing Quadratic Functions from Factored Form
How do you graph a quadratic function efficiently? Explore graphing quadratic functions by writing in intercept form with a lesson plan that makes a strong connection to the symmetry of the graph and its key features before individuals...
EngageNY
Exploring the Symmetry in Graphs of Quadratic Functions
Math is all about finding solutions and connections you didn't expect! Young mathematicians often first discover nonlinear patterns when graphing quadratic functions. The lesson begins with the vocabulary of a quadratic graph and uses...
Curated OER
Curve Sketching Review Worksheet
In this curve sketching instructional activity, students solve 13 short answer and graphing questions. Students find maximums, minimums, critical points, turning points, increasing/decreasing intervals, etc.
Curated OER
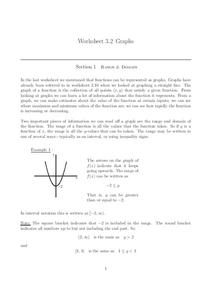
Graphs
In this graphs worksheet, students solve and complete 15 various types of problems. First, they determine the range of the function of the graph shown and write in interval notation. Then, students find the domain of the function in the...
EngageNY
Interpreting Quadratic Functions from Graphs and Tables
Seeing functions in nature is a beautiful part of mathematics by analyzing the motion of a dolphin over time. Then take a look at the value of a stock and maximize the profit of a new toy. Explore the application of quadratics by...
Mathematics Assessment Project
Temperatures
As a middle school assessment task, learners first examine line graphs of monthly temperatures for two locations, and then match box plots to each line plot.
Curated OER
Worksheet 23 - Directional Derivative
In this function worksheet, students compute the directional derivative of a function and identify the xy-coordinates of the maximum and local minimum. This two page worksheet contains six multi-step problems.
Inside Mathematics
Graphs (2004)
Show your pupils that perimeter is linear and area is quadratic in nature with a short assessment task that requests learners to connect the graph and equation to a description about perimeter or area. Scholars then provide a...
Inside Mathematics
Graphs (2007)
Challenge the class to utilize their knowledge of linear and quadratic functions to determine the intersection of the parent quadratic graph and linear proportional graphs. Using the pattern for the solutions, individuals develop a...
Curated OER
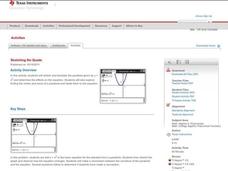
Stretching the Quads
Scholars investigate transforming parabolas. In this transforming parabolas instructional activity, they take the parent graph y=x^2 and transform it by shifting left, right, up, and down and shrinking and stretching. The class finds...
Curated OER
Line Graphs 4
In this graph learning exercise, students interpret given line graphs. They determine the range, and identify the range in a set of data. This one-page learning exercise contains approximately 14 problems.


