Polar Trec
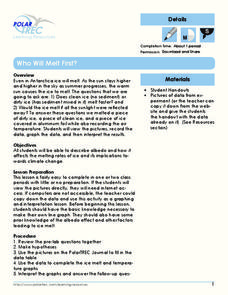
Who Will Melt First?
If the Greenland ice sheet melted, sea levels would rise by about 20 ft; if the Antarctic ice sheet melted, sea levels would rise by 200 ft. Scholars explore ice melting through the analysis of different ice samples, clean and dirty ice....
Nevada Outdoor School
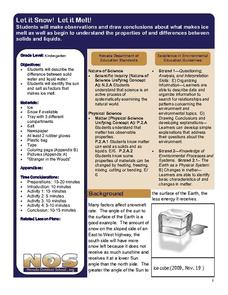
Let It Snow! Let It Melt!
Winter weather offers a great opportunity to teach young scientists about the states of matter. This activity-based lesson includes a range of learning experiences, from experimenting with the rate at which ice melts to singing a song...
Beyond Benign
The Big Melt: Arctic Ice Caps
Are the Arctic ice caps really melting out of existence? Junior climatologists examine the statistics of ice decline through four math-based lessons. Each activity incorporates data, climate information, and environmental impact into an...
Curated OER
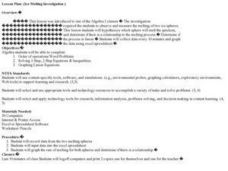
Ice Melting Investigation
Students conduct an ice melting investigation in which they observe and measure the melting of two ice spheres. They develop a hypothesis as to which sphere will melt the fastest, collect data every ten minutes, and graph the data using...
California Academy of Science
Global Climate Change and Sea Level Rise
Ice is nice, and its condition on the planet has a significant effect. Junior geoscientists experiment with ice melting in both water and on land to discover how each affect the rising sea level. This detailed lesson outline even...
Curated OER
Changing Planet: Melting Glaciers
Resource links to a video, satellite images, data, and photographs of glaciers provide emerging earth scientists the opportunity to examine how the ice has been retreating over the years. A data table is included for pupils to record...
Curated OER
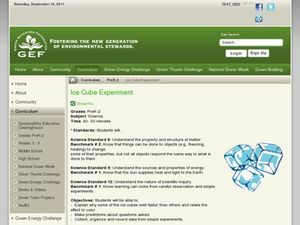
Ice Cube Experiment
Students explore the rate at which ice melts. In this science lesson, students place ice cubes on colored index cards and place them in direct sunlight. Students observe which ice cubes melt fastest and slowest.
University of Waikato
Melting Glacial Ice
There are many factors that affect how fast the glaciers are melting. A lab investigation has learners examine how the surrounding water affect the rate glaciers melt. They collect data from two samples of ice to determine how quickly...
Curated OER
Ice
Students examine the different propereties of ice, such as freezing temperature. In this scientific lesson students complete several activities using ice, like making ice cream.
Discovery Education
Cool It!
Adjust the melting time of ice without varying the temperature! Learners experiment with different materials to decide how the materials affect the rate an ice cube melts. They then connect their findings to the conductivity of each...
Discovery Education
It's Melting!
It's a race to the finish! Which ice cube will melt the fastest? Scholars discover the effect thermal energy has on melting ice. They experiment with melting ice cubes on different materials and learn that even at a consistent...
Curated OER
Chemical Reaction Rates
Students observe demonstrations to show factors that affect rates of chemical reactions. In this rates of chemical reactions instructional activity, students investigate how catalysts, reactant concentrations, temperature and surface...
Curated OER
Melting Ice
Students observe the melting of ice and explore the basic physical changes that occur. They gain information of how different substances change the rate of melting. Students discuss the properties of water and ice, the definition of...
Curated OER
Calculus Worksheet: Rate of Change (2)
In this rate of change worksheet, students compute the amount of time a block of ice will take to melt. There is only one question on the page.
Curated OER
Ice Breakers
Middle schoolers understand the effects of global warming on icecaps. They investigate the worldwide consequences that may result.
Curated OER
Sources of Heat
Fourth graders conduct an experiment related to heat sources, and participate in a heat source hunt. They identify sources of heat, then compare the melting rate of ice cubes, illustrating the results in their science journal. Students...
Curated OER
Interactive Notes-"Electricity"
Students explore electricity. In this interactive electricity lesson plan, students create static electricity with balloons, observe the rate at which ice melts to identify conductors and insulators, and create a static charge. ...
Curated OER
FOLLOW THAT WATER
Students build simple stream tables and vary the angle of the stream tables in order to simulate different flow rates and compare the results. They observe various features formed in a stream table by flowing water and compare these to...
Curated OER
Antarctica’s Melting and the Affect it has on the Ocean
Students calculate how much mass is lost and gained by Antarctica yearly. In this earth science instructional activity, students graph and analyze data from the given handout. They explain how this affects the world climate.
National Wildlife Federation
The Tide is High, but I’m Holding On… Using ICESat Data to Investigate Sea Level Rise
Based on the rate of melting observed from 2003-2007 in Greenland, it would take less than 10 minutes to fill the Dallas Cowboys' Stadium. The 17th instructional activity in a series of 21 has scholars use the ICESat data to understand...
Curated OER
WS 2.5 Dimensional Analysis
Science students apply dimensional analysis to relate quantities in six different problems. They consider the cost of steak, a young man's growth rate, a medicine prescription, fuel efficiency, and more. This worksheet is a great way to...
Beyond Benign
Daphnia Bioassay LD50
De-icing materials may have a harmful effect on our environment; have your class perform an experiment to test the nature of these effects. Scholars monitor the survival rate of a sample of daphnia as the concentration of a de-icing...
NOAA
Please Pass the Salt
Salinity is the focus of two experimenters that work to answer the question, How does salt change the physical properties of water? Super scientists compare the freezing rate of salt and fresh water, combine the two waters to observe how...
Curated OER
Antarctic Meltdown?
In this geography worksheet, students read an excerpt about how scientist are examining changes in the Arctic and Antarctic ice caps. They use the information in the excerpt and any other references listed to answer the three questions...


