CPO Science
The Periodic Table
Here is a six-page exploration that will spark interest in the periodic table of elements. After reading a diagram-supported explanation of the periodic table's organization, pupils answer questions to familiarize themselves with it. To...
Curated OER
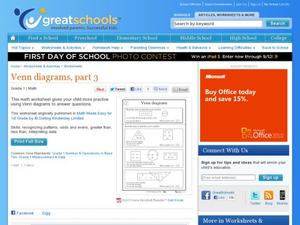
Venn Diagrams, Part 3
Can your first graders interpret Venn diagrams? Different sets of clues help pupils narrow down a specific number in different shapes. They determine odds and evens, greater than or less than, and what shape the number is in. A fun...
EngageNY
From Ratio Tables to Double Number Line Diagrams
How much sugar is in one bottle? Pupils use double number line diagrams to determine the amount of sugar in a 1L bottle of cola. The teacher leads a discussion on ways that double number lines can be of assistance in solving a problem...
Inside Mathematics
Scatter Diagram
It is positive that how one performs on the first test relates to their performance on the second test. The three-question assessment has class members read and analyze a scatter plot of test scores. They must determine whether...
Mathed Up!
Stem and Leaf Diagrams
Order the data within a stem-and-leaf display. Pupils take data and create and ordered stem-and-leaf diagrams, including the key. Participants take their data and determine answers about the information. Class members then find measures...
American Chemical Society
The Periodic Table and Energy-Level Models
Teach your class to think of electrons as tiny packets of energy that travel in waves. Through a short video and diagram, participants see how electrons are located around the nucleus of an atom. They then get into groups and try to...
K12 Reader
Displaying Data
It's important to learn how to display data to make the information easier for people to understand. A reading activity prompts kids to use context clues to answer five comprehension questions after reading several paragraphs about...
Curated OER
Student Costs Data Table
Young scholars compare and contrast two routes selected for a virtual field trip. They create a data table of educational activities, lodging, and meal costs using Microsoft Excel software.
National Science Teachers Association
Hop into Action
Young scientists find out what makes amphibians such unique and interesting animals in this simple life science lesson. After looking at pictures and discussing the characteristics of amphibians, learners complete a series of three Venn...
Ontario
Reading Graphic Text
Do students really need to be taught how to read cartoons, comic books, and comic strips? Yes. Just as they need to learn how to read other forms of graphic text such as diagrams, photos, timetables, maps, charts, and tables. Young...
English Worksheets Land
Penny and Her Dad
A divorce can seem like everything's changing, but some things do stay the same. Read a passage about Penny and her parents, comparing and contrasting the ways her parents' houses are the same and are different.
Curated OER
Periodic Table Basics
In this periodic table worksheet, students answers 10 fill in the blank questions by reading information form a periodic table. Then also complete Bohr Models of the atoms of 12 different elements.
Curated OER
Size of Atoms - Trends
This compendious collection of slides leaves no questions when it comes to the concept of atomic size. Thorough and easy-to-read graphs, tables, and graphics explain atomic radii, the shielding effect, the octet rule, isoelectric...
Curated OER
Amazing Carbon
Explore carbon and bonding with this worksheet. First, class members read a short excerpt about carbon and its characteristics. In response to the reading, they draw an electron dot diagram of carbon as well as diagrams of compounds...
Curated OER
Countables and Uncountables Exercise 1
Young writers determine whether the 19 nouns in the box are accountable or uncountable. They place each noun in the Venn Diagram and then fill in each blank in 9 sentences with the words a, an, any and/or some. A good worksheet!
Curated OER
Reading in the Science Content Area
Help your students internalize scientific ideas by teaching strategies for reading in the content area.
Curated OER
The Atom
In this atom activity, students read about the parts of the atom and how atoms combine into molecules and compounds. Students learn how to read a periodic table. This activity has 20 fill in the blank and 10 matching questions.
Fluence Learning
Writing an Opinion: Buddies that Bark or Purr-fect Pets?
Which animal is best for you—a dog or cat? Why? Engage third graders in an opinion writing assessment that prompts them to read facts about both pets, and then write and decide which pet is best for them.
Noyce Foundation
Ducklings
The class gets their mean and median all in a row with an assessment task that uses a population of ducklings to work with data displays and measures of central tendency. Pupils create a frequency chart and calculate the mean and median....
Curated OER
Using Diagrams in Problem Solutions
Students use tables, graphs and diagrams to collect data. In this problem solving with diagrams lesson plan, students construct their own tables and graphs containing information they gather from a drawing. They also make a Venn Diagram...
Curated OER
Canadian Social Trends
Students use surveys to explore how to design graphs, tables, and diagrams. They discuss articles which can stimulate ideas for research topics, or surveys of their own.
EngageNY
Equivalent Ratios
Equivalent ratios show up on tape. Young mathematicians use tape diagrams to create equivalent ratios in the initial activity on the topic. They learn the definition of equivalent ratios and use it to build others in the third segment of...
Tutorials Point India Private
E-Commerce Tutorial
How does electronic commerce benefit organizations, customers, and society? Scholars read about e-commerce as it applies to modern business practices in an informative tutorial. Pupils also discover different types of business models in...
Wild BC
The Greenhouse Effect: Warming the Earth Experiment
First in a two-part lesson on the greenhouse effect, this lesson involves a classroom demonstration of the phenomenon, and a lab group experiment with color and absorption. Although there are easier ways to demonstrate the greenhouse...


