EngageNY
Summarizing Bivariate Categorical Data with Relative Frequencies
It is hard to determine whether there is a relationship with the categorical data, because the numbers are so different. Working with a familiar two-way table on super powers, the class determines relative frequencies for each cell and...
EngageNY
Conditional Relative Frequencies and Association
It is all relative, or is it all conditional? Using an exploration method, the class determines whether there is an association between gender and superpower wish through the use of calculating conditional relative frequencies. The last...
Flipped Math
Frequency Tables
What's the association? Pupils watch a presentation on creating a two-way frequency table. Learners find out how to calculate relative frequencies within the table to determine whether there is an association between the two categories....
Florida Center for Reading Research
Phonics: High-Frequency Words, Word Fishing
To practice reading high-frequency words fluently, learners play a fishing game at a learning center. They take turns fishing; each fish contains a single high-frequency word. To keep the fish they caught, they must be able to read the...
Project Maths
Probability and Relative Frequency
It's all relatively simple once you get the gist. Young mathematicians learn about sample spaces and simple probability by conducting an activity with dice. To complete the second of six parts in the Statistics and Probability unit, they...
Mathed Up!
Probability and Relative Frequency
Go ahead and take a chance. Given the probability of an event, scholars determine the frequency of the event out of a sample. The part of a review series for the General Certificate of Secondary Education math assessment asks classmates...
Curated OER
Frequency Distributions
In this statistics worksheet, students solve 5 frequency problems. In four of the problems, the frequency table is provided and students construct one relative frequency table, one cumulative frequency table, and two cumulative relative...
EngageNY
Describing a Distribution Displayed in a Histogram
The shape of the histogram is also relative. Learners calculate relative frequencies from frequency tables and create relative frequency histograms. The scholars compare the histograms made from frequencies to those made from relative...
ESL Kid Stuff
Time Frequency - "How Often ...?"
How often do you ride a bike? Time frequency words are featured in a lesson designed for ESL/ELD classrooms.
EngageNY
The Difference Between Theoretical Probabilities and Estimated Probabilities
Flip a coin to determine whether the probability of heads is one-half. Pupils use simulated data to find the experimental probability of flipping a coin. Participants compare the long run relative frequency with the known theoretical...
Curated OER
State Names: Frequency
Data grathers determine the frequency of specified data. They identify the frequency that specified letters occur in the names of all 50 states. They create stem-and-leaf plots, box-and-whisket plots and historgrams to illustrate the data.
Concord Consortium
Mystery Dice
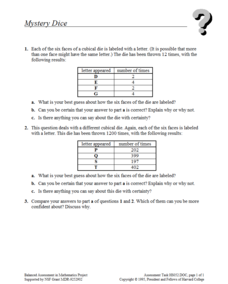
Dice aren't typically mysterious devices, but these dice are anything but typical. Scholars try to come up with dice that match given information on the relative frequency when they roll them a certain number of times. They must then...
NASA
What's the Frequency, Roy G. Biv?
While all light travels at the same speed, each color in the visible light spectrum contains a different wavelength and frequency. Scholars determine the relationship between frequency and wavelength as they complete the activity. They...
Charleston School District
Two-Way Tables
Do males or females buy more iPhones? Using a two-way frequency table can help to answer this question. Pupils learn to create two-way frequency tables and then how to analyze the data within the tables. Learners find frequencies,...
Mathematics Vision Project
Module 8: Modeling Data
Statistics come front and center in this unit all about analyzing discrete data. Real-world situations yield data sets that the class then uses to tease out connections and conclusions. Beginning with the basic histogram and...
EngageNY
Summarizing Bivariate Categorical Data in a Two-Way Table
Be sure to look both ways when making a two-way table. In the lesson, scholars learn to create two-way tables to display bivariate data. They calculate relative frequencies to answer questions of interest in the 14th part of the series.
MENSA Education & Research Foundation
Probably Probability
Reinforce the concept of probability with a series of lessons highlighting the idea of likelihood, probability formulas, relative frequency, outcomes, and event predictions. The collection is made up of four lessons offering informative...
Curated OER
Shedding Light on the Weather with Relative Humidity
Learners study weather using a graphing calculator in this lesson. They collect data for temperature and relative humidity for every hour over a day from the newspaper, then place the data in their handheld calculator and examine it for...
Curated OER
Relative Frequency
In this relative frequency activity, students first read the information about how to calculate probability using a formula. Students solve 24 problems. This page is intended for online use but may be completed on paper.
Mathed Up!
Two Way Tables
When presented with categorical data, a two-way frequency table is a great way to summarize the information. Pupils organize categorical data using a two-way table, then use the tables to determine missing data and to calculate simple...
Scholastic
Study Jams! Sound
Listen in as Mia and Sam expound on sound. It is caused by vibrations and travels in waves. It has the qualities of pitch, frequency, and volume. This hip animation displays a graph to depict the frequency and amplitude of sound waves....
Baylor College
Rainbow in the Room
Uncover the science behind the beautiful phenomena of rainbows with a simple demonstration. Shine light through different-sized containers of water as young scientists learn that rainbows occur when visible light is split up into its...
Pennsylvania Department of Education
What is the Chance?
Fourth and fifth graders make predictions using data. In this analyzing data lesson plan, pupils use experimental data, frequency tables, and line plots to look for patterns in the data in order to determine chance. You will need to make...
Curated OER
Going Graph-y
Second graders listen to and dicuss the story Where the Wild Things Are. They play a pantomime game and act out various feelings so their classmates can guess. They listen for the frequency of certain words, and record their findings on...
Other popular searches
- Relative Frequency Table
- Histogram Relative Frequency
- Graphing Relative Frequency
- Genetic Relative Frequency
- Dna Relative Frequency


