Inside Mathematics
Winning Spinners
Winning a spin game is random chance, right? Pupils create a table to determine the sample space of spinning two spinners. Individuals determine the probability of winning a game and then modify the spinners to increase the probability...
Shodor Education Foundation
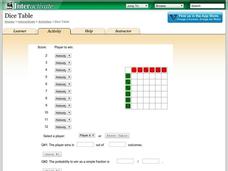
Dice Table
Convert a table to probabilities. Pupils set up the winning rules for the sums of two dice. Using the rules, the applet fills out a table showing the winners for each combination. Learners determine the probabilities of winning for each...
Curated OER
Probability - Worksheet
Middle schoolers solve and complete four various types of problems. First, they list all the possible orders completed. Then, pupilscomplete the table and show all the outcomes of throwing a coin and spinning a spinner. They also use a...
Statistics Education Web
It’s Elemental! Sampling from the Periodic Table
How random is random? Demonstrate the different random sampling methods using a hands-on activity. Pupils use various sampling techniques to choose a random sample of elements from the periodic table. They use the different samples to...
EngageNY
Using Sample Data to Estimate a Population Characteristic
How many of the pupils at your school think selling soda would be a good idea? Show learners how to develop a study to answer questions like these! The lesson explores the meaning of a population versus a sample and how to interpret the...
Curated OER
Using Random Sampling to Draw Inferences
Emerging statisticians develop the ability to make inferences from sample data while also working on proportional relationships in general. Here, young learners examine samples for bias, and then use random samples to make inferences...
Mathed Up!
Stratified Sampling
Young mathematicians learn how to solve problems involving stratified sampling. They review concepts of sampling and proportionality by watching a video and then they complete a worksheet of questions on this topic.
Curated OER
Integrated Algebra Regents Questions: Combinations and Probability
For this combinations and probability worksheet, students solve 3 short answer problems. Students draw tree diagrams to represent possible outcomes in a sample space. Students determine the probability of an event.
Curated OER
Make a Frequency Table and a Histogram for a Given Set of Data
In this data recording and data organization learning exercise, students create one frequency table and one histogram for a given list of data. Explanations and examples for frequency tables and histograms are given.
Curated OER
Ingetrated Algebra Practice
For this integrated algebra worksheet, students solve probability problems. They identify the appropriate sample space for the given experiment. This two-page worksheet contains 4 multiple-choice problems. Answers are provided on the...
College Board
2004 AP® Statistics Free-Response Questions Form B
Over the years, data analysis has been important. Looking back to the 2004 AP® Statistics Form B free-response questions, pupils and teachers see the importance of analysis of data sets. The six questions contain analysis of data on...
Curated OER
Galaxy Hunter - A Cosmic Photo Safari
Space science stars journey through our night sky and take virtual photos of galaxies to investigate simple random samples. Higher math is used to analyze the data collected. Copy the evaluation/assessment questions onto a handout for...
Achieve
False Positives
The test may say you have cancer, but sometimes the test is wrong. The provided task asks learners to analyze cancer statistics for a fictitious town. Given the rate of false positives, they interpret the meaning of this value in the...
Teach Engineering
Are We Alone?
Find an answer to the age-old debate of whether life exists on Mars. Groups determine criteria to help look for signs of life on Mars. The activity has the class simulate testing Martian soil samples for signs of life before drawing...
Willow Tree
Histograms and Venn Diagrams
There are many different options for graphing data, which can be overwhelming even for experienced mathematcians. This time, the focus is on histograms and Venn diagrams that highlight the frequency of a range of data and overlap of...
Curated OER
Sampling Snoops
Pupils practice formulating a hypothesis and designing an experiment to test the hypothesis. They identify several sampling techniques they can use to test their hypotheses.
College Board
2003 AP® Statistics Free-Response Questions Form B
Update the statistics in your course using older AP® questions. The 2003 AP® Statistics free-response questions cover several of the concepts in the current statistics standards for all pupils. Items contain questions about determining...
College Board
1998 AP® Statistics Free-Response Questions
Free-response questions form the 1998 AP® Statistics exam allow class members to analyze data from real-life situations. The situations include tracking defective parts, tracking butterflies, evaluating weed killers and determining...
EngageNY
Mid-Module Assessment Task: Grade 7 Mathematics Module 5
Determine the probability that the class knows probability. The three-question assessment presents problems with finding the sample space and the probability, theoretical and experimental, of a variety of situations. Pupils also describe...
Mathematics Vision Project
Module 8: Probability
It's probably a good idea to use the unit. Young mathematicians learn about conditional probability using Venn diagrams, tree diagrams, and two-way tables. They also take into consideration independence and the addition rules.
American Statistical Association
A Sweet Task
Candy is always an effective motivator! A fun math activity uses M&M's and Skittles to explore two-way frequency tables and conditional probability. The candy can serve a dual purpose as manipulatives and experimental data.
Space Awareness
Oceans as a Heat Reservoir
Oceans absorb half of the carbon dioxide and 80 percent of the greenhouse gases released into the atmosphere. Scholars learn how and why the oceans store heat more effectively than land and how they help mitigate global warming. Pupils...
Curated OER
Atlatl Lessons Grades 4-12: Lesson for Beginning Users of Atlatl
Sixth graders determine the mean, range median and mode of a set of numbers and display them. In this data lesson students form a set of data and use computer spreadsheet to display the information. They extend of the process by looking...
Curated OER
Tree Diagrams
In this tree diagrams worksheet, students solve and complete 10 different problems that include creating tree diagrams. First, they toss a coin and roll a die simultaneously to determine the outcomes with a tree diagram. Then, students...


