NASA
Exploring Data
Bring the sun to your class! Young scholars analyze actual solar wind data in the second lesson of a five-part series. Their analysis includes speed, temperature, and density data.
Illustrative Mathematics
Weather Graph Data
Teaching young mathematicians about collecting and analyzing data allows for a variety of fun and engaging activities. Here, children observe the weather every day for a month, recording their observations in the form of a bar graph....
Curated OER
Using Data from Sensors
Beginning with a discussion about using technology to collect data, this resource includes a video about the next Mars rover as an example. Young scientists are taught that filtering is necessary before collected data can be analyzed....
Curated OER
What Can Data Tell Us?
Students explore data distribution. In this data analysis lesson, students create a data distribution table by playing the game "Tower of Hanoi" from the Hall of Science. Students analyze their data and answer data driven questions.
Chicago Botanic Garden
Plant Phenology Data Analysis
Beginning in 1851, Thoreau recorded the dates of the first spring blooms in Concord, and this data is helping scientists analyze climate change! The culminating instructional activity in the series of four has pupils graph and analyze...
Math Moves U
Collecting and Working with Data
Add to your collection of math resources with this extensive series of data analysis worksheets. Whether your teaching how to use frequency tables and tally charts to collect and organize data, or introducing young mathematicians to pie...
Bonneville
Solar Panel Data Sharing
It's important to share—especially in science. Pupils share the data on voltage, current, and resistance they recorded when they built circuits with solar cells in a previous lesson. They discuss the results with the class and consider...
Curated OER
Deep Convective Clouds
Young scholars observe clouds. In this deep convective clouds lesson, students analyze cloud data recorded over one month and draw conclusions based on results. Young scholars predict "Thunderstorm Season" and prepare to defend their...
Omaha Zoo
I Like to Move It
What do lemurs do best? They move! Lemurs like to jump, run, hop, and climb and it's your class's job to document seven fun lemur behaviors. The class starts by discussing why lemurs are considered primates, and then they isolate seven...
Education Development Center
Creating Data Sets from Statistical Measures
Explore the measures of central tendency through a challenging task. Given values for the mean, median, mode, and range, collaborative groups create a set of data that would produce those values. They then critique other answers and...
Code.org
Identifying People with Data
How much information about you is out there? Scholars explore this question as they investigate data breaches and how these violations occur. They then take part in an activity where they research how easily people could get access to...
Curated OER
Applied Science - Science and Math Lab 4B
Learners experiment with the combination of vinegar and baking soda. In this applied science lesson, future scientists compare qualitative and quantitative data collected from their exploration. Then they work together to analyze and...
Curated OER
Using MY NASA DATA to Determine Volcanic Activity
Students explore how aerosols are used in science to indicate volcanic activity and how biomass burning affects global aerosol activity. Students access data and import into MS Excel using graphical data to make inferences and draw...
Curated OER
Using Vegetation, Precipitation, and Surface Temperature to Study Climate Zones
Using NASA's Live Access Server, earth scientists compare the temperature, precipitation, and normalized difference vegetation index for four different locations. They use the data to identify the climate zone of each location using...
Curated OER
What Can Data Tell Us?
Young scholars analyze data they have collected themselves and by their classmates. In groups, they create data distributions to identify the highest, lowest and middle values. As a class, they discuss the concept of sample size and how...
Curated OER
Dance Challenge: Calculate and Compare Speed by Measuring a Series of Dance Movements
Really neat! Kids choreograph a dance phrase and then measure the distance and speed of the phrase using a timer and a meter stick. They collect the data on a table which they use to determine an average. A series of observation and...
Curated OER
Physical Science: Festival of Bubbles
Investigate bubbles through the use of scientific inquiry. Pupils blow bubbles using several methods and measure the resulting bubble print. Measurements are recorded on a data table and transferred to a bar graph. Results are discussed...
Curated OER
Creating Climographs
Students use satellite data to compare precipitation and surface temperatures on different islands. In this satellite lesson students create graphs and explain the differences between weather and climate.
Teach Engineering
Backyard Weather Station
Challenge young meteorologists to apply their knowledge of weather to build their own weather stations. The resource provides the directions to build a weather station that contains a wind vane, barometer, thermometer, and rain gauge....
Curated OER
Lesson Plan Outline for Rainbow Science
Young scientists study light reflection and refraction as they determine the critical angle, the rainbow angle, and color separation in rainbows. Teams record the data they collect in a shared spreadsheet and discuss results with the class.
Raytheon
Data Analysis and Interpretation
For this data analysis and interpretation worksheet, learners use charts, graphs, statistics to solve 42 pages of problems with answer key included.
Curated OER
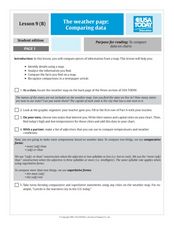
The Weather Page: Comparing Data
Students recognize the different types of data on the weather page of USA Today. For this weather lesson, students compare weather data comparative and superlative forms of adjectives. Students locate 10 pieces of information in the data...
Curated OER
The Weather Page-Comparing Data
Learners examine weather patterns in the United States. In this weather lesson, students use a United States map to identify high and low temperatures in two states. Learners compare the data and record their findings onto a chart.
Curated OER
Veggie Chop and Data Analysis
First graders chop vegetables into fractions. In this fractions lesson, 1st graders cut vegetables, collect data about favorite vegetables and create a bar graph using the information. Students make inferences about the data and record...


