CK-12 Foundation
Linear Equations: Temperature Transitions
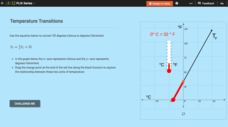
Explore linear conversions using an engaging interactive lesson. Learners drag a point on a graph to discover the equivalent degrees in Fahrenheit and Celsius. Embedded questions highlight key features such as slope and the y-intercept.
CK-12 Foundation
Broken-Line Graphs: Heating Curve of Water
Examine the unique graphs coined broken-line graphs. Using the phase change of water for data, learners answer questions related to the temperature and energy at different times in the cycle of the phase change. Questions focus on the...
Curated OER
Temperature High and Lows
Students gather high and low temperature readings through email. In this temperature graphing lesson, students use a spreadsheet to input data for a graph. students interpret the graphs to compare and contrast the data from different...
Curated OER
Interpreting A Line Graph - Practice Problems 15.3
For this interpreting a line graph worksheet, students read a graph and answer a question. Students are taken through the problem solving process by being asked to understand, plan, solve and look back at the end of the worksheet and...
Curated OER
The Effect of Temperature on Cricket Chirping
High schoolers examine the effect of temperature on how often crickets chirp. In groups, they complete the experiment and answer lab discussion questions. They create a graph of temperatures and the amount of chirps and discuss the results.
Curated OER
A Comparison of Land and Water Temperature
Students examine NASA satellite observations of surface temperature and investigate the seasonal changes of land and water temperature.
Curated OER
Dissolved Oxygen and Temperature
Young scholars are shown how temperature affects dissolved oxygen and they create a graph showing this relationship. They think about the adaptations of animals to live in different water temperatures. Students test four different water...
Curated OER
Linkages Between Surface Temperature and Tropospheric Ozone
High schoolers use data microsets of mean near-surface air temperature and tropospheric ozone residual averages to infer patterns. Students analyze changes in tropospheric ozone and then hypothesize about the consequences of these changes.
Space Awareness
The Climate in Numbers and Graphs
Weather versus climate: weather relates to short time periods while climate averages the weather of a period of many years. Scholars learn about average temperature and precipitation in various climate zones and then apply statistics...
Curated OER
Using Graphs
Print and use this useful unit on basic algebraic functions, domain, range, and graphing. Tasks include, illustrating simple functions with a graph, and identifying the domain and range of the function. This twelve-page packet contains...
National Security Agency
Line Graphs: Gone Graphing
Practice graphing and interpreting data on line graphs with 36 pages of math activities. With rationale, worksheets, and assessment suggestions, the resource is a great addition to any graphing unit.
NASA
Geographical Influences
"If global warming is real, why is it so cold?" Distinguishing the difference between weather and climate is important when it comes to understanding our planet. In these activities, young scientists look at the climate patterns in a...
California Academy of Science
California's Climate
The United States is a large country with many different climates. Graph and analyze temperature and rainfall data for Sacramento and Washington DC as you teach your class about the characteristics of Mediterranean climates. Discuss the...
Chymist
The Solubility of a Salt in Water at Various Temperatures
An educational instructional activity allows young chemists to test the solubility of different types of salt at various temperatures. Groups create a graph using data from unsaturated, saturated, and supersaturated solutions.
Curated OER
Graphs 2
For this graph practice worksheet, students examine a graph and use their problem solving skills on order to respond to 5 questions regarding the information presented on the graph.
NASA
Comparing Temperature and Solar Radiation for Common Latitudes
There's snow much to learn! Excited individuals use real-world data to discover how latitude affects the odds of a snow day. Scientists compare latitude, solar radiation, and temperature using NASA data for several locations....
CK-12 Foundation
Determining the Equation of a Line: Temperature Conversion Challenge
Line up the temperature conversions. Pupils create the linear function between Celsius and Fahrenheit on a graph by plotting the freezing and boiling points of water. The scholars determine how the relationship changes based upon...
Curated OER
Graphing the Facts
Middle schoolers investigate the correlation between our planet's weather and solar activity. They analyze and discuss data regarding the solar activity cycle, graph annual precipitation and temperature averages over a period of 100...
University of California
Seasons Lab Book
Unlock the mystery behind seasonal change with a collection of worksheets and activities. Whether they are drawing pictures of Earth's orbit around the sun or graphing the temperature and daylight hours of different locations from around...
EngageNY
Conversion Between Celsius and Fahrenheit
Develop a formula based upon numerical computations. The 31st part of a 33-part unit has the class determine the formula to convert a temperature in Celsius to a temperature in Fahrenheit. They do this by making comparisons between the...
Centers for Disease Control and Prevention
Microbe Multiplication Magic
A lesson introduces the reproduction rate of E. coli though a video. Then scholars complete a data table and graph of reproduction rates in ideal conditions as well as less than ideal conditions.
US Environmental Protection Agency
Getting to the Core: The Link Between Temperature and Carbon Dioxide
Polar ice samples provide scientists with valuable information about the condition of the atmosphere for hundreds of thousands of years in the past. Of particular interest is the amount of carbon dioxide in the atmosphere and its...
Curated OER
Tracking Fall's Falling Temperatures
Young meteorologists track weather from day to day and record results on graphs, maps, or other places. They see firsthand how weather temperatures trend cooler as fall progresses and practice grade-appropriate skills in geography (map...
Curated OER
Excel temperature Graphs
Learners gather data about the weather in Nome, Alaska. In this Nome Temperature lesson, students create an excel graph to explore the weather trends in Nome. Learners will find the average weather and add a trend line to their graph.


